
Tutorial: Retirement Planning
The Retirement Planner answers one practical question: will your money last? It runs 1,000 Monte Carlo simulations using your real portfolio, taxes, income, and spending, then shows your probability of fully funding retirement through your life expectancy and updates the moment you change an input.
What you'll find in this tutorial
You do not have to follow these in order. Click any section to jump straight to it, or open the Retirement Planner in the app to follow along.
- Read your retirement result
- View it as a Chart, Breakdown, or Table
- Set your core inputs
- Fine-tune with More settings
- Run what-if scenarios
- Run the Liquidity Stress Test
- Improve your probability of success
- Learn more: How the planner works, Assumptions and limitations, Common use cases, and Next steps.
Throughout, the red markings on each screenshot point to exactly what the text is describing: a (1) in the text matches the 1 badge on the image. Where the phone layout differs, a mobile screenshot follows the desktop one.
Read your retirement result
Go to Plan, then Retirement Planning (the Retirement Planning / Estate Planning toggle at the top of the page). Three things tell you where you stand:
- Your probability of success: a headline such as "We ran 1,000 simulations of your future life in various market conditions. 91% of them were successful" means a 91% chance of fully funding your retirement through your life expectancy under your current assumptions (1).
- The projected-wealth chart: the solid Expected outcome line is the midpoint (50th percentile) result, and the dashed Poor outcome line is a weak (10th percentile) result.
- Chart, Breakdown, and Table: use the toggle at the top right of the result to change how you view the scenario (2).
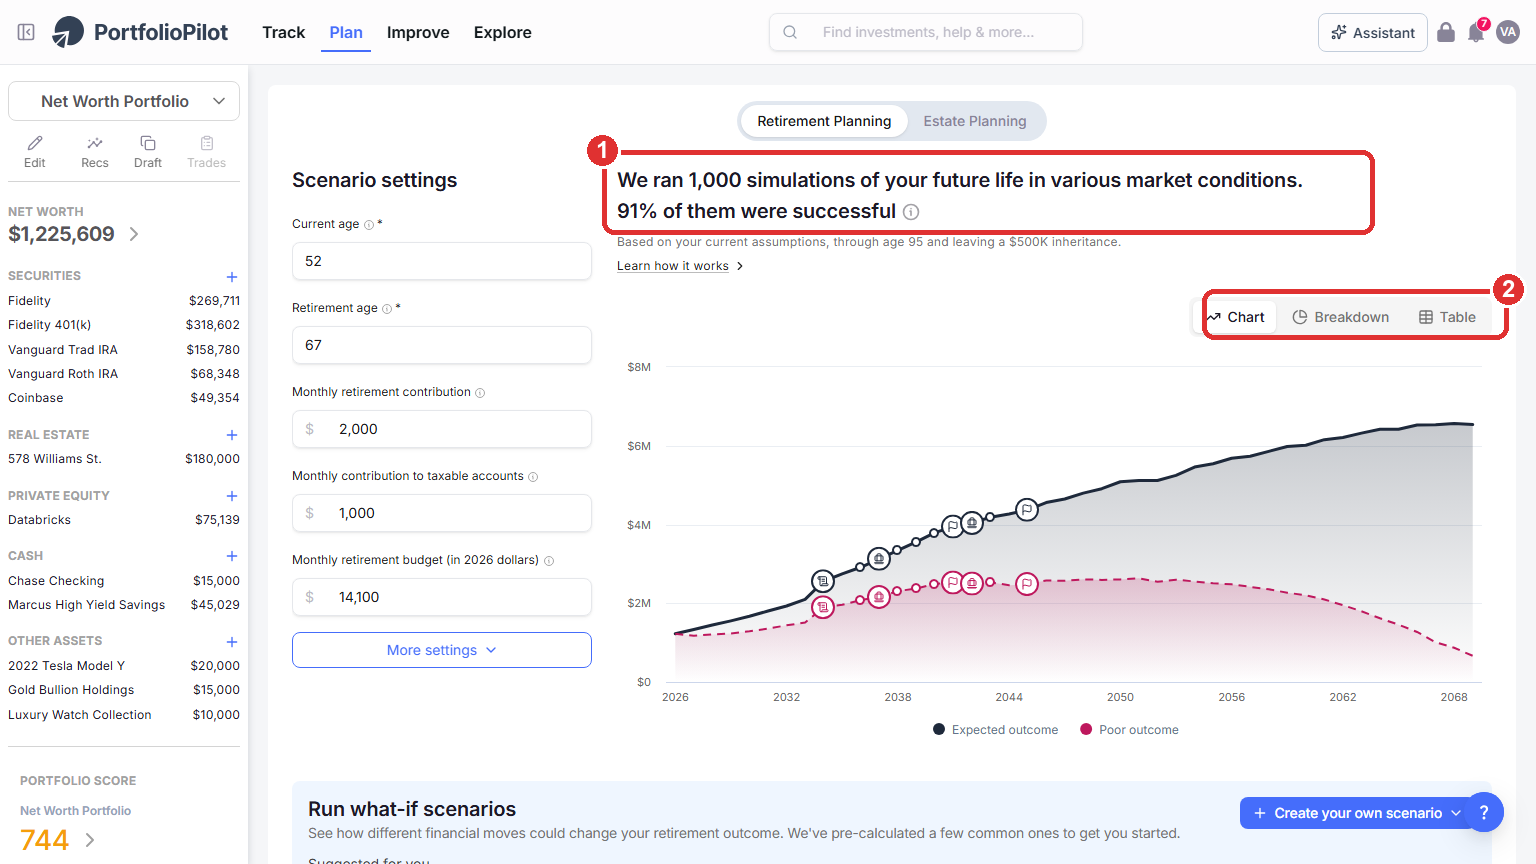
Plan → Retirement Planning: your probability of success and the projected-wealth chart. Figures shown are illustrative.
On a phone, the same result appears at the top: the headline probability of success (1) and the Chart, Breakdown, and Table toggle (2).
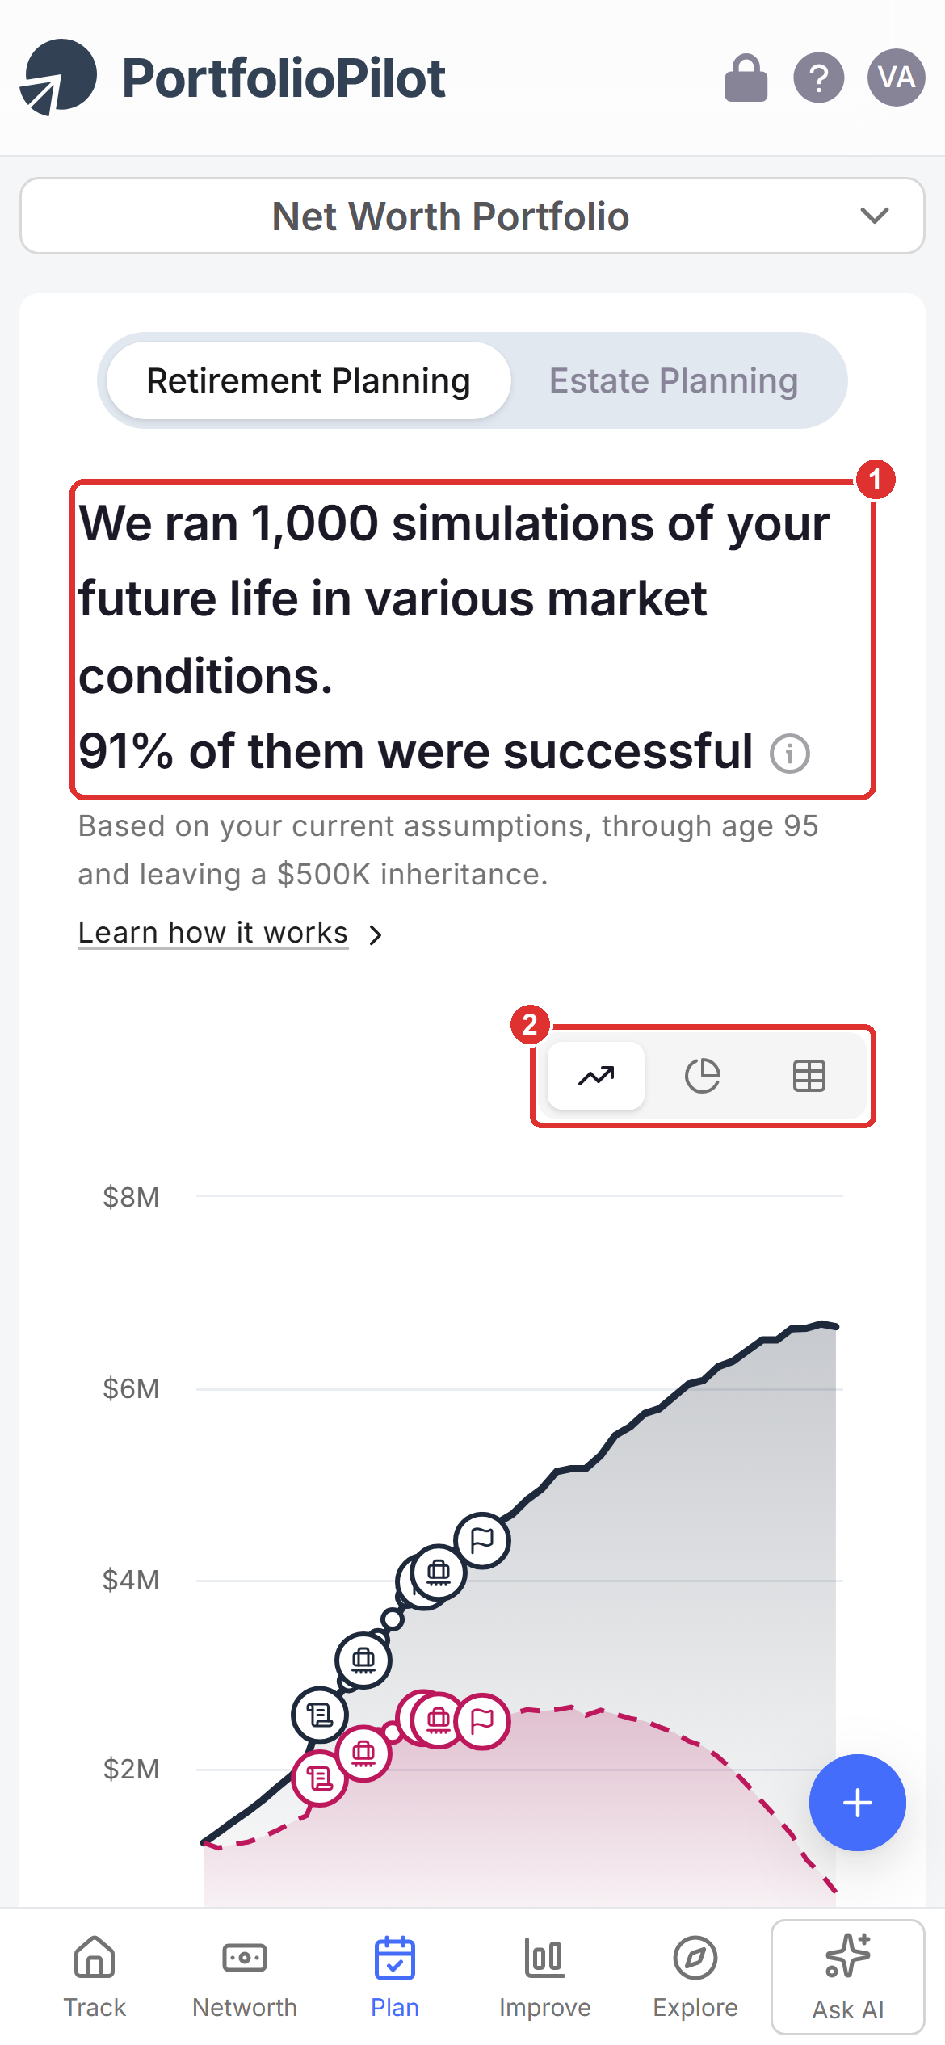
Mobile view: the same result and chart on a phone. Figures shown are illustrative.
View it as a Chart, Breakdown, or Table
Use the Chart, Breakdown, and Table toggle to switch how you read the projection:
- Chart: plots your projected wealth over time.
- Breakdown: shows how your assets are composed over the years.
- Table: lists the full year-by-year detail: each year and age, the phase (accumulation or retirement), any life events that hit that year, your strategy, total assets, and the split between tax-free and taxable balances (1).
- Download breakdown: export the whole scenario as a spreadsheet to keep or share the complete numbers (2).
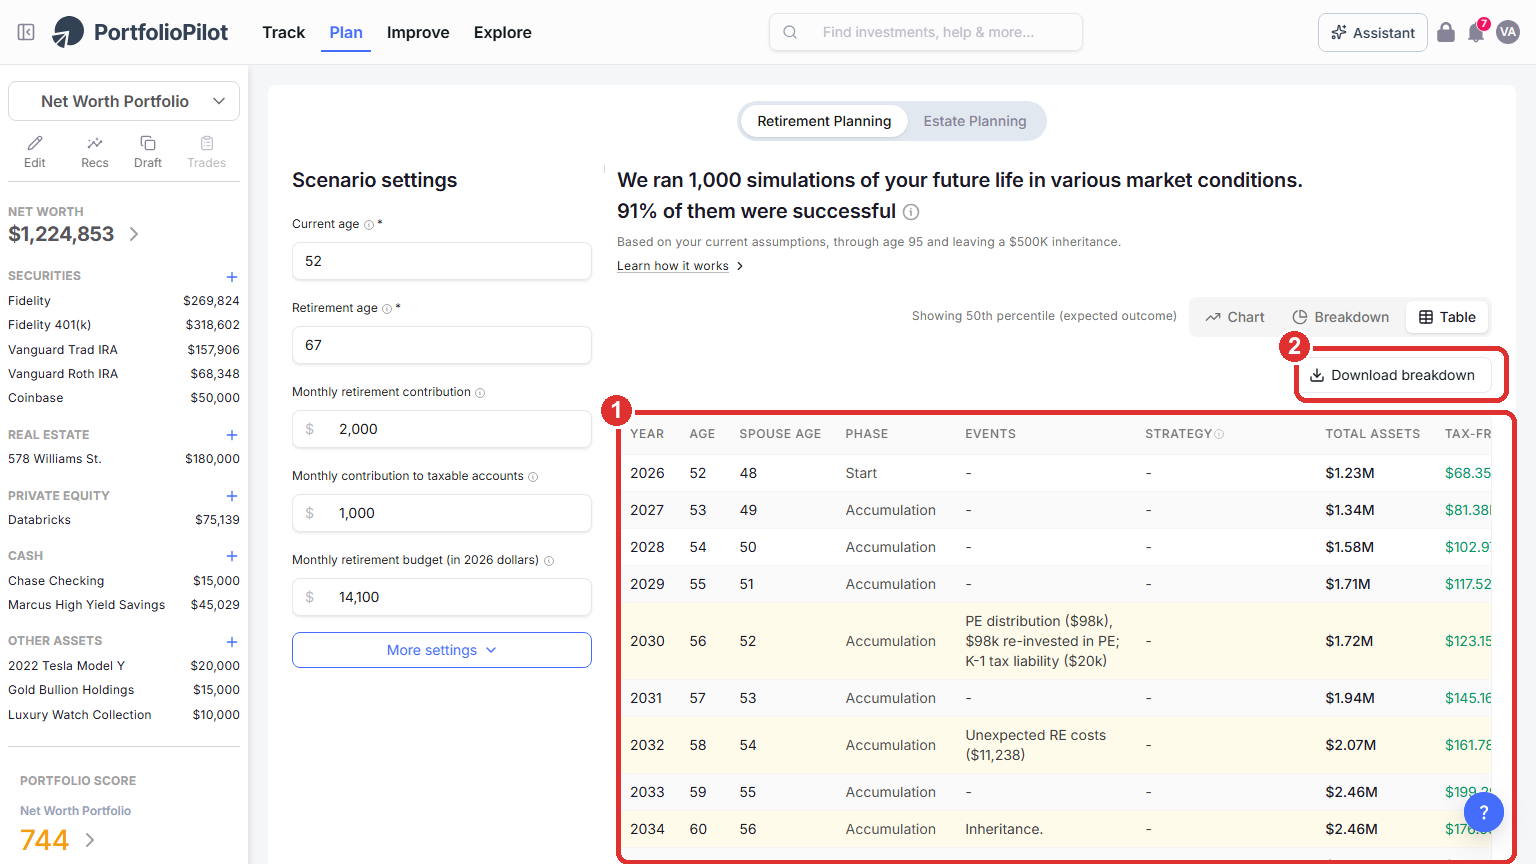
The Table view: the full year-by-year detail of a scenario, with Download breakdown to export it. Figures shown are illustrative.
Set your core inputs
In Scenario settings on the left, set the inputs that shape every simulation:
- Current age and Retirement age.
- Monthly retirement contribution and Monthly contribution to taxable accounts.
- Monthly retirement budget (in today's dollars).
The result recalculates as you type, so you can watch your probability of success respond. To explore early retirement (sometimes called FIRE), set a low retirement age, for example 45, and see how the probability and the Expected and Poor outcome lines move.
On a phone, Scenario settings stacks these same inputs vertically (1), with More settings just below (2).
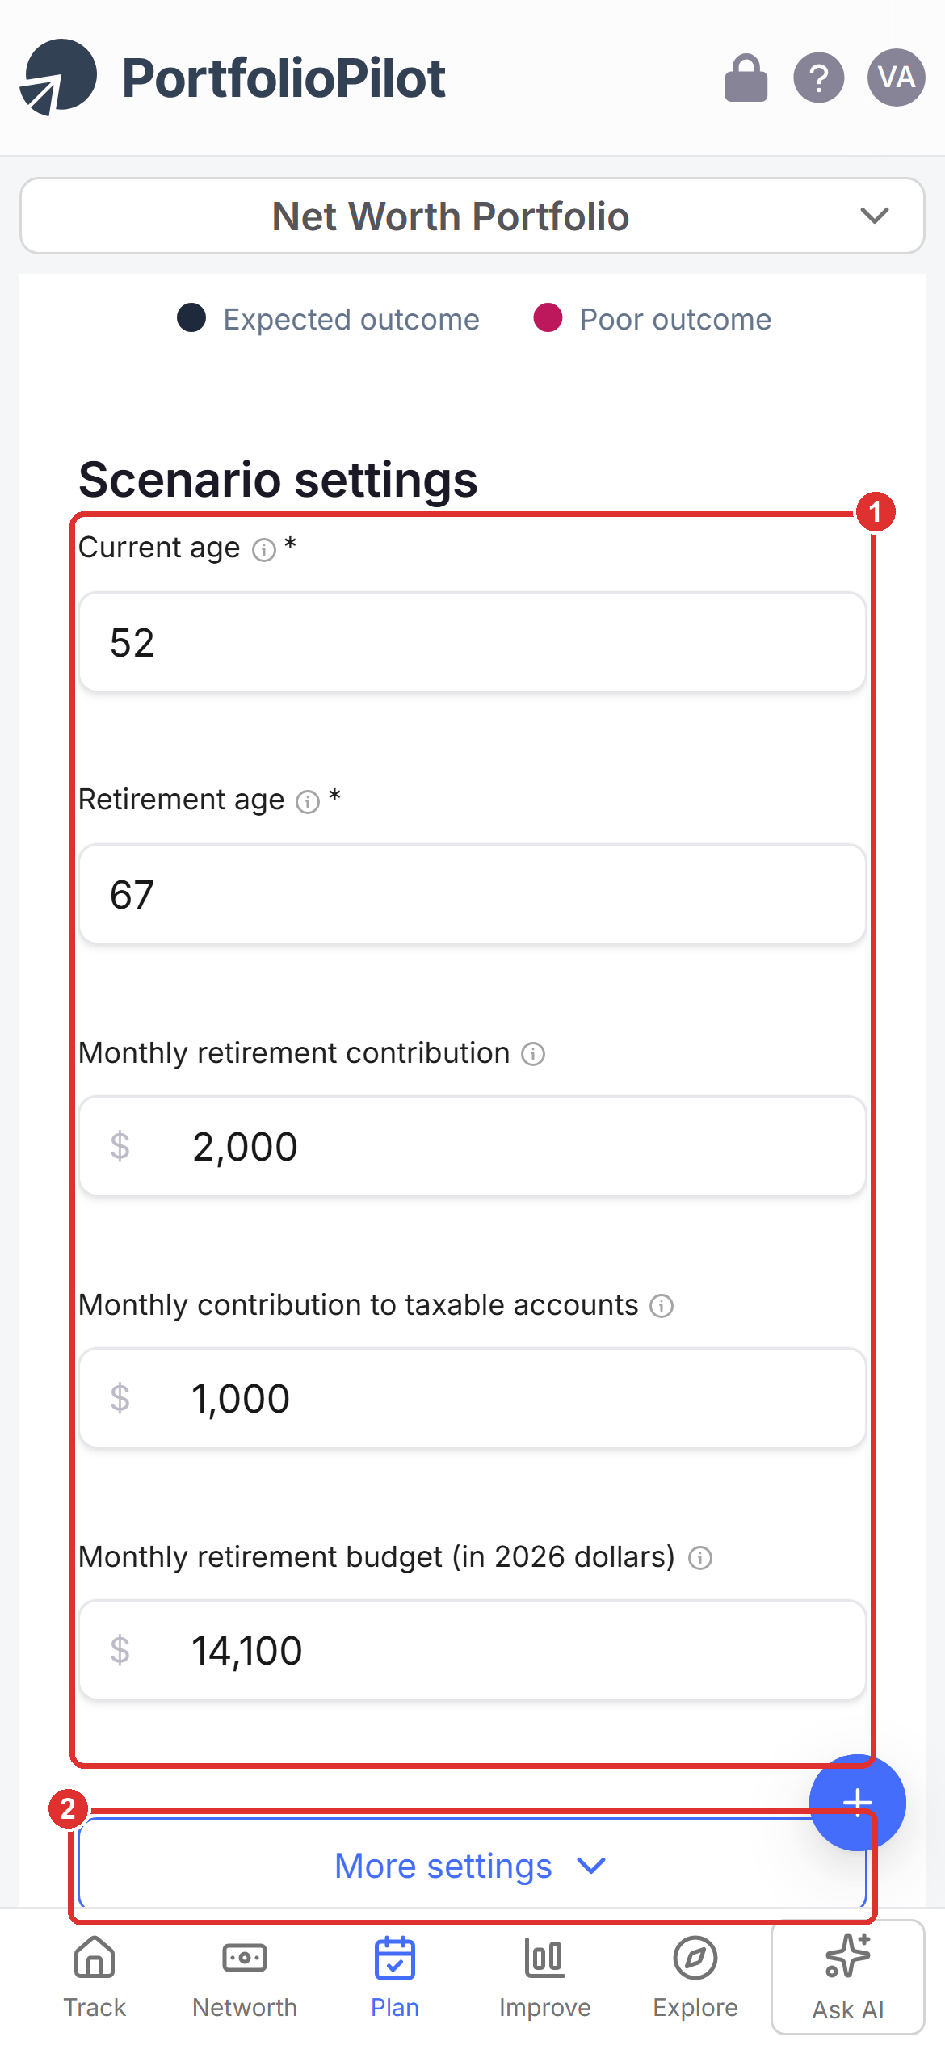
Mobile view: the core inputs stack vertically, with More settings below.
Fine-tune with More settings: People, spouse, and Social Security
Choose More settings to open six tabs, in product order: People, Life events, Money in & out, Portfolio, Taxes & withdrawals, and Model settings (1). This tutorial covers them in that same order.
- People: set your life expectancy, Social Security benefit and start age, and any amount you want to leave to heirs (2).
- Spouse / partner: to plan as a couple, set Include separately? to Yes and enter your partner's ages, retirement age, and Social Security.
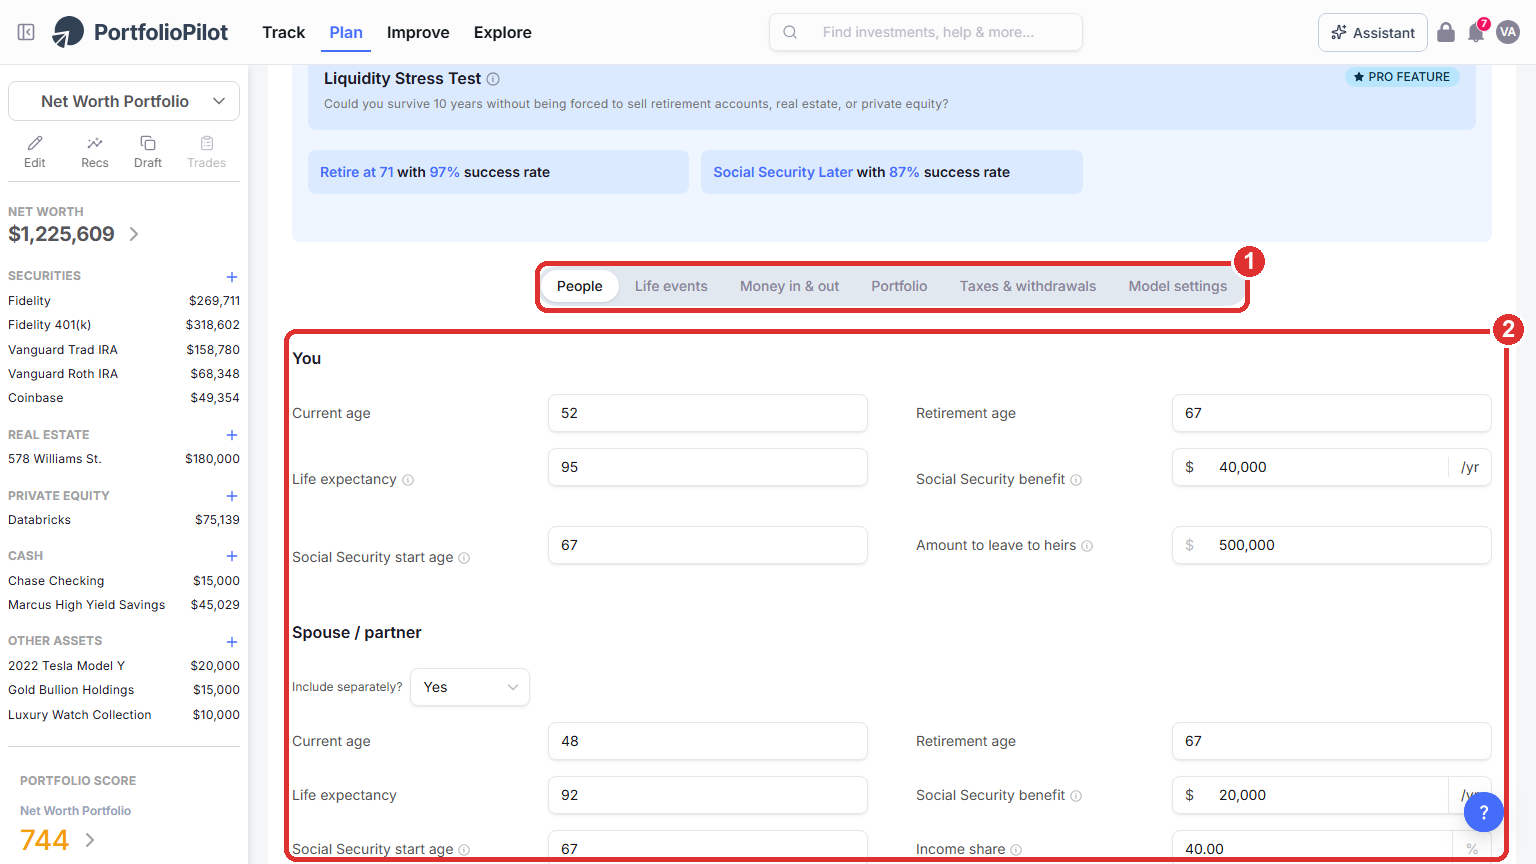
More settings opens six tabs. The People tab holds your age, life expectancy, Social Security, legacy, and the Spouse / partner option.
On a phone, the six tabs become a swipeable row (1) above the same People fields (2).
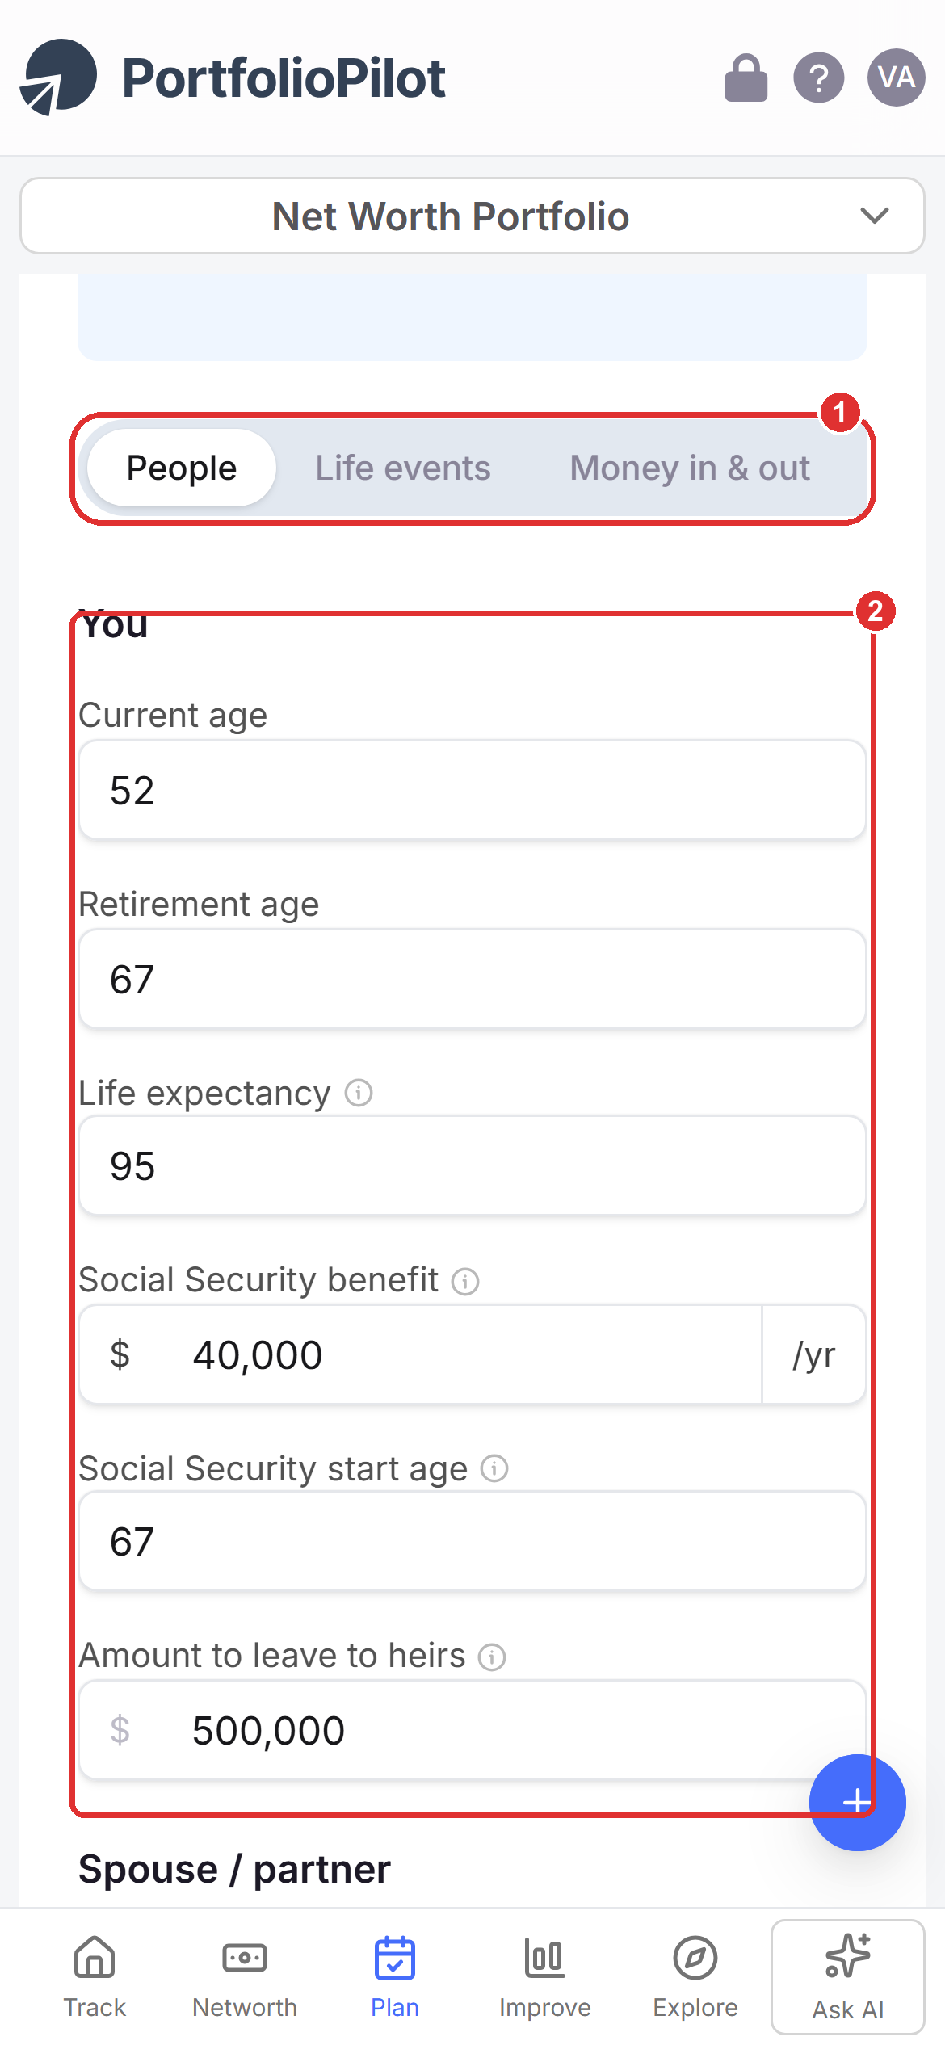
Mobile view: the six More settings tabs become a swipeable row above the fields.
Life events and milestones
On the Life events tab, model one-time milestones such as a move, an inheritance, a home purchase, selling a business, or a big trip:
- Add life event: choose this to add a milestone (1).
- Pick a type: a down payment, home improvement, college tuition, marriage, severance, divorce, insurance proceeds, a big trip, selling a business, purchasing another property, an inheritance, a move to a different state, funeral expenses, or a custom event (2).
- Set the details: for each event, set the timing, the amount, and whether it increases, decreases, or transfers wealth.
Every event flows into the simulations and updates your probability of success.
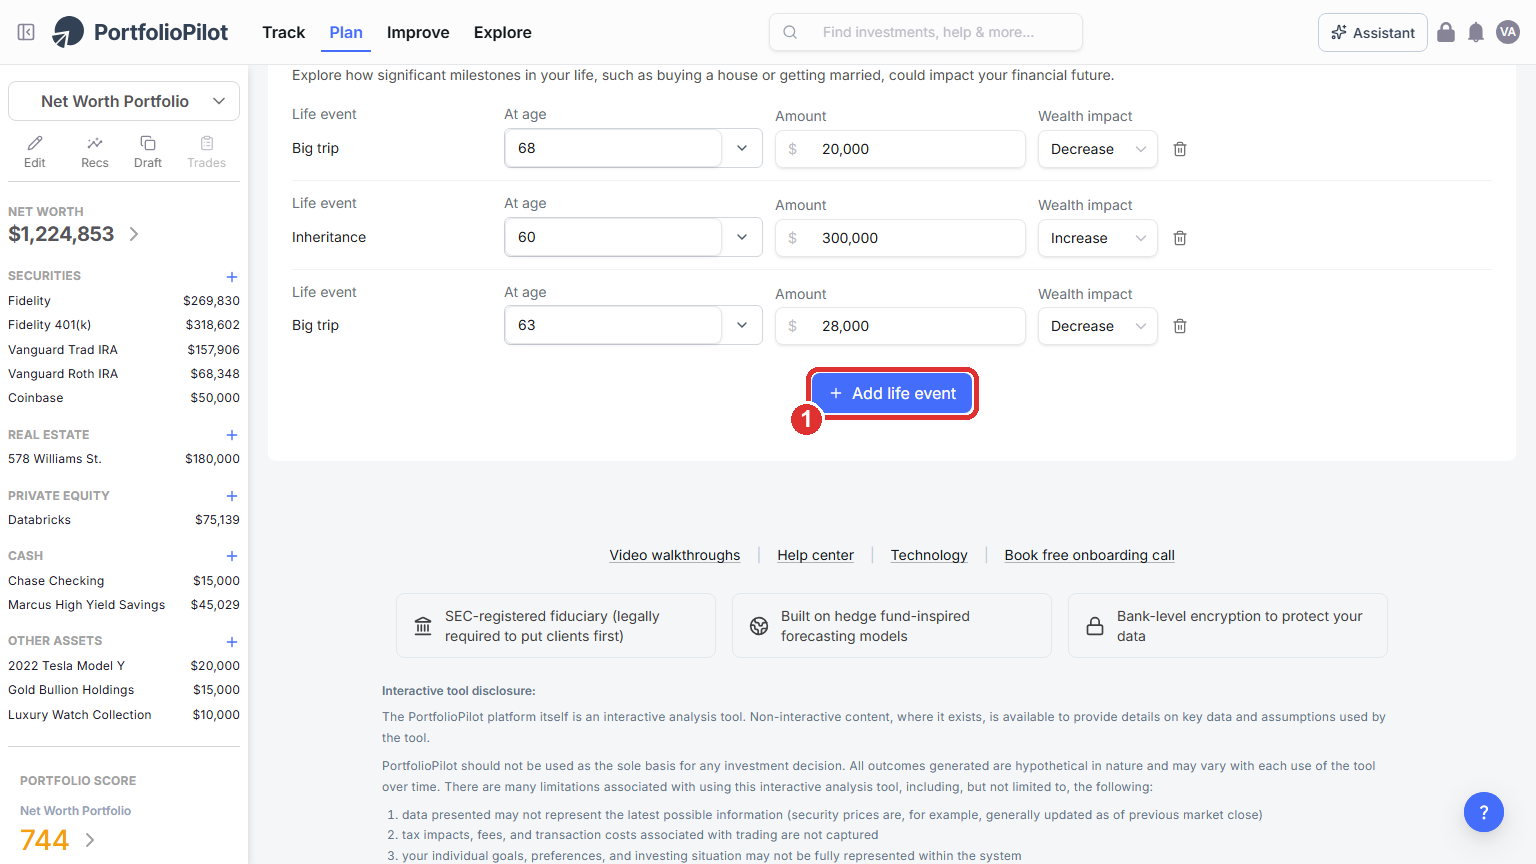
Life events: model one-time milestones and their wealth impact.
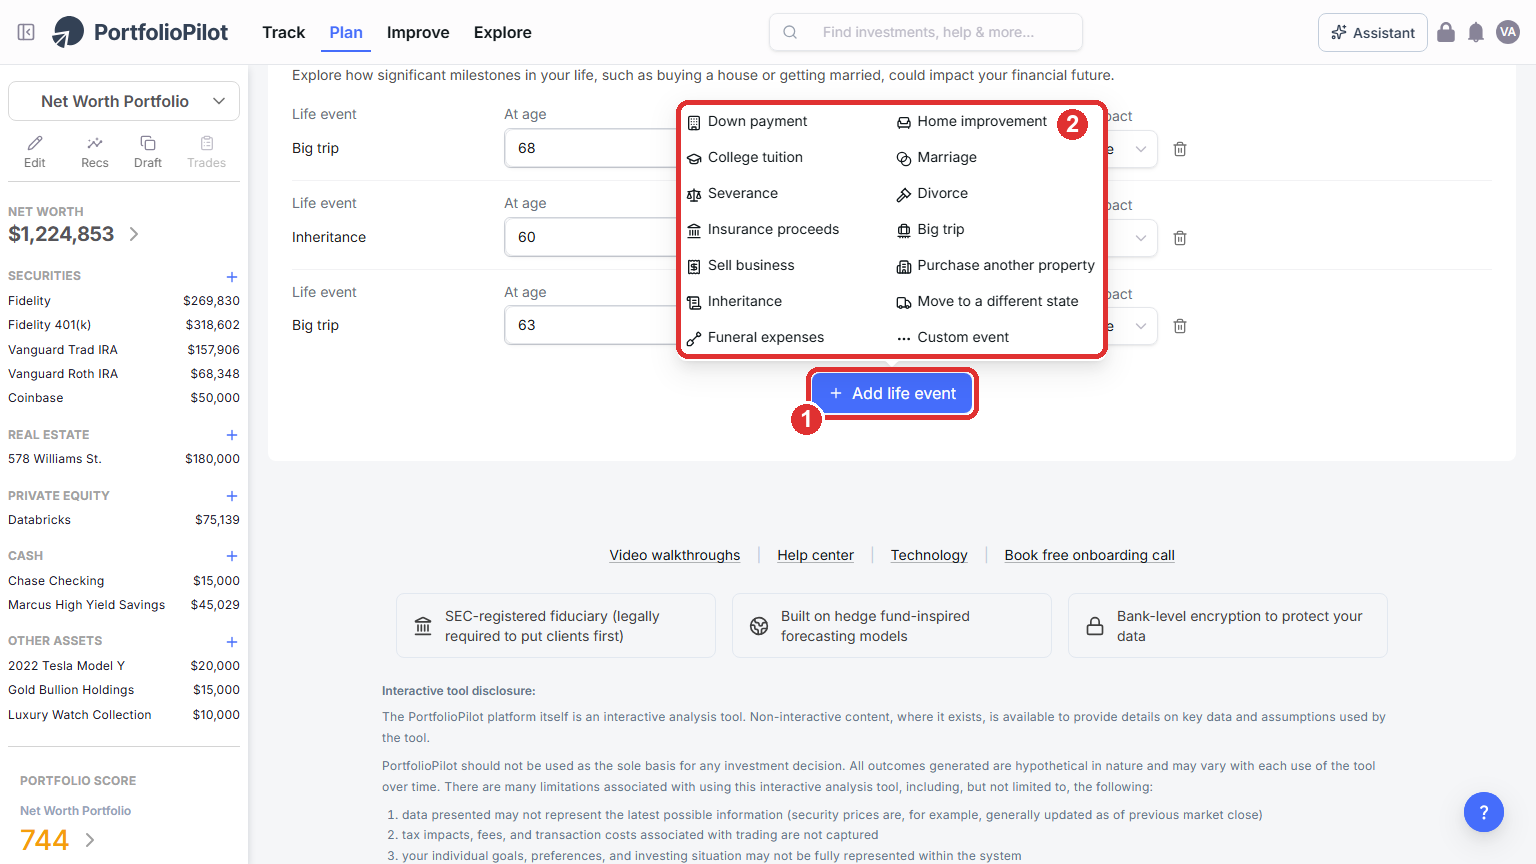
Add life event: choose from common milestones, or create a custom one.
Money in & out: income, pensions, and recurring cash flows
On the Money in & out tab, set the cash flowing in and out over your lifetime:
- Basic income: your Current yearly income and Yearly income growth, any Pension or other retirement income, and a One-time pension payout at retirement (1).
- Recurring income and expenses: use Add payment to model ongoing items over a date range, such as travel or long-term care, and mark each one as an increase or a decrease to your wealth (2).
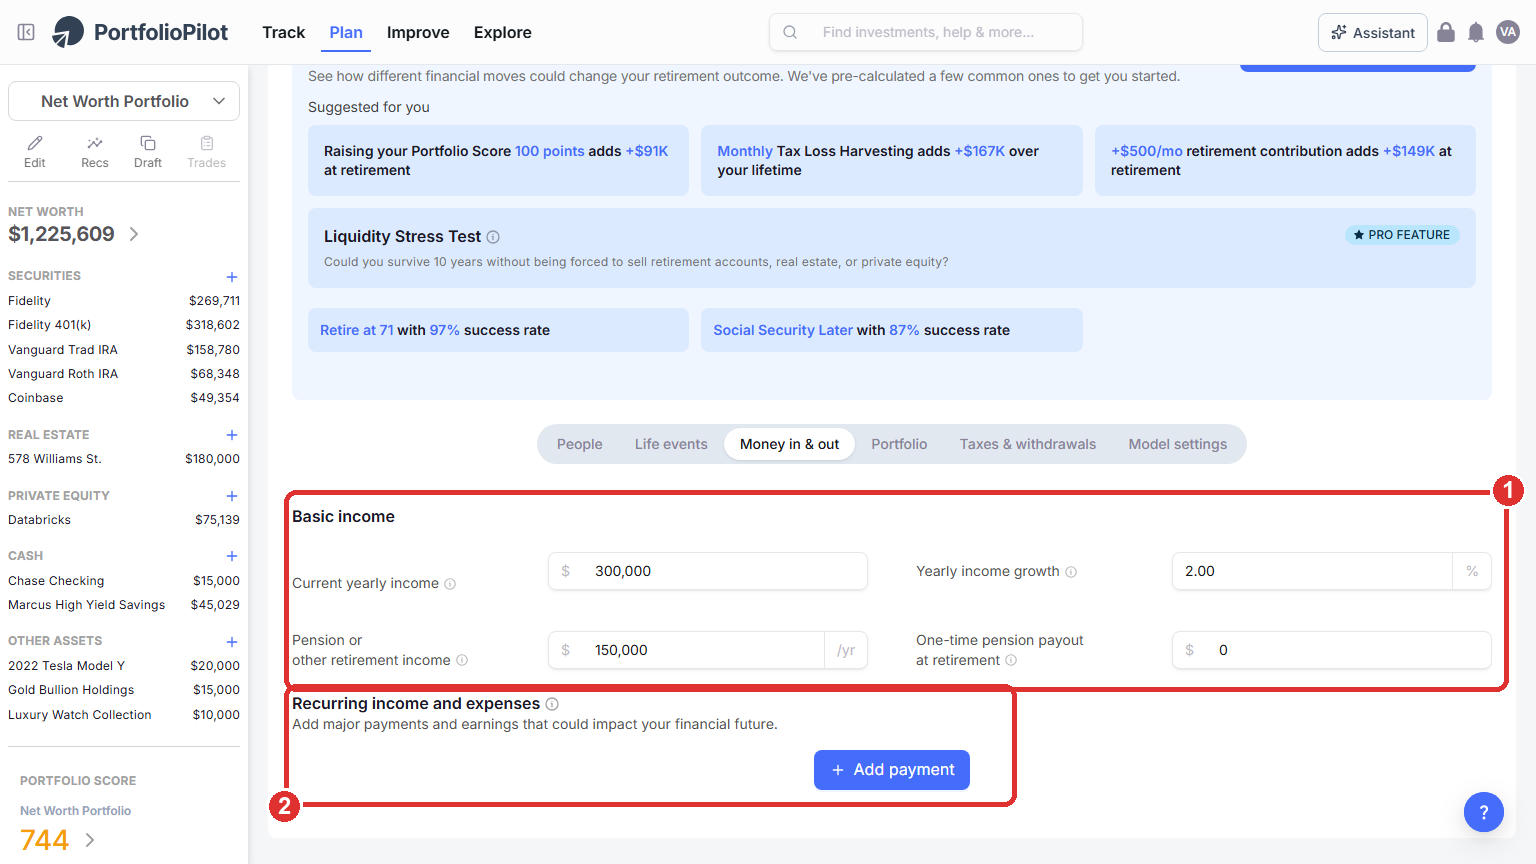
Money in & out: income, growth, pensions, and recurring cash flows over date ranges. Figures shown are illustrative.
To add a recurring item, choose Add payment (1) and pick from a list of common types (2): a big salary change, charitable contributions, annuity payments, family support, a reverse mortgage, long-term care, medical expenses, or a custom payment.
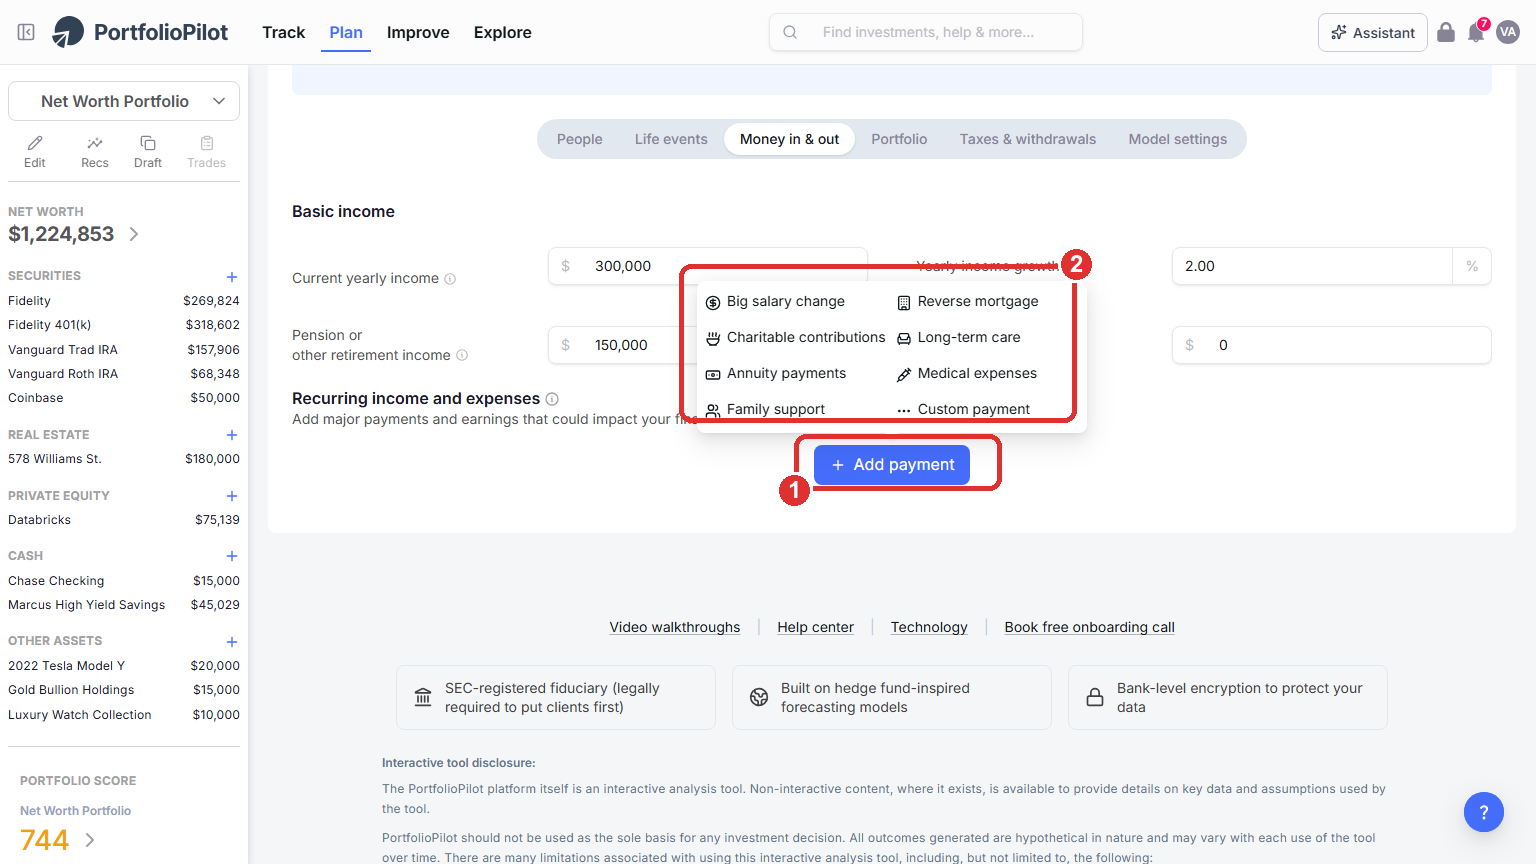
Add payment: choose from common recurring income and expense types, or create a custom one.
Portfolio: risk, returns, and fees
On the Portfolio tab, set the assumptions behind your projected growth:
- Fees and rebalancing: your Investment management fee and Rebalancing schedule (1).
- Risk and returns: your before-retirement and in-retirement risk levels and return assumptions (returns default from the risk levels, but you can override them) (2).
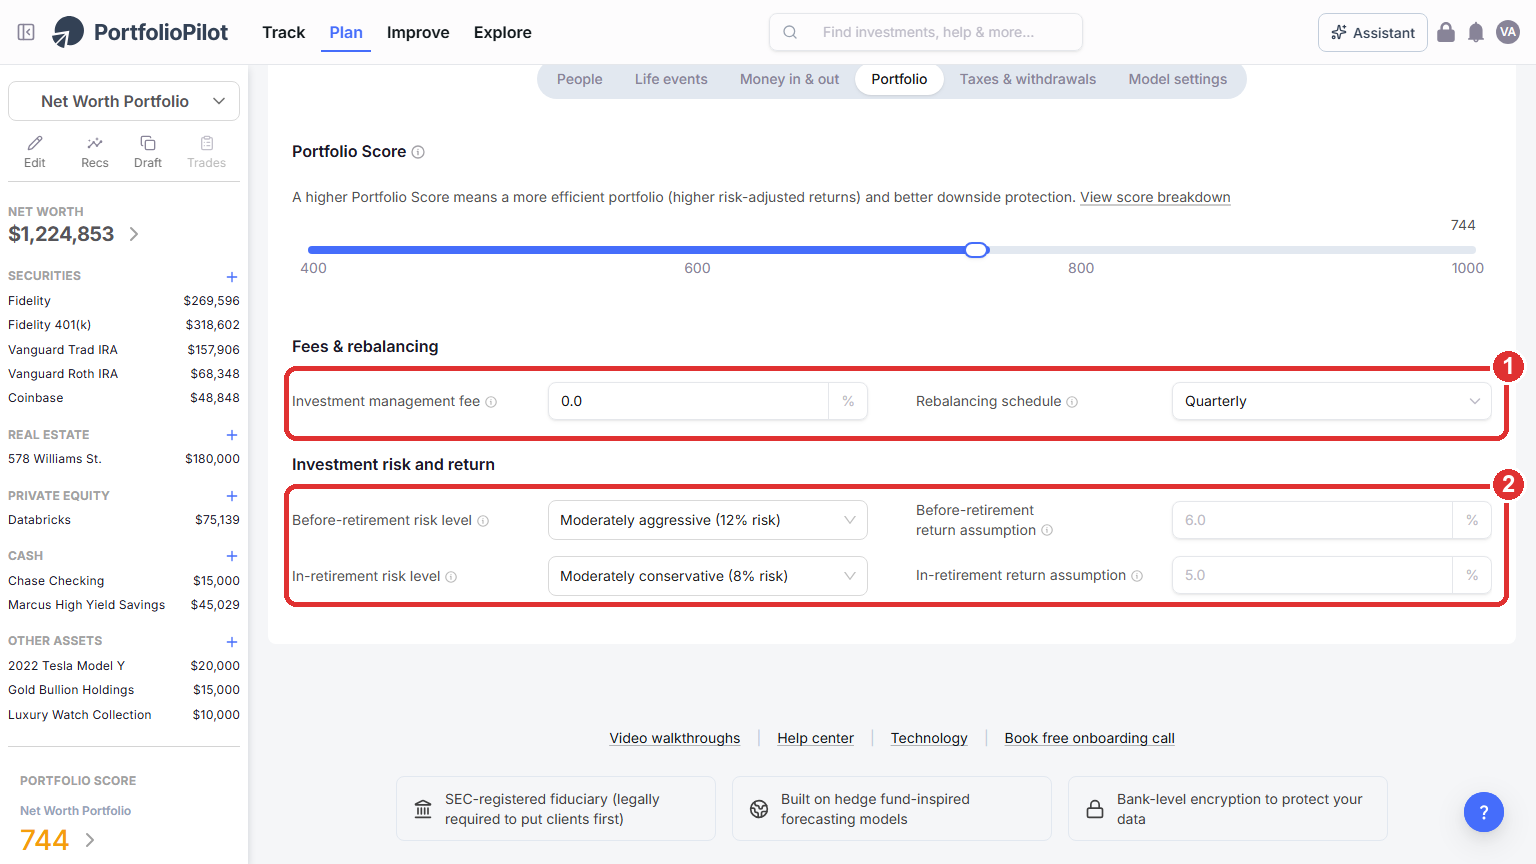
Portfolio: fees, rebalancing, and your before- and in-retirement risk and return assumptions.
Taxes, Roth conversions, and withdrawals
On the Taxes & withdrawals tab, set your tax filing status and country and state of residence, then model the choices that drive your after-tax outcome:
- Roth conversions: choose Add Roth conversion to move money from tax-deferred accounts into Roth over a set age range. This can raise taxes in the conversion years but reduce future taxable withdrawals and RMDs (1).
- Tax-efficient withdrawal order: with Withdrawal order set to Tax-efficient withdrawal (Recommended), the model draws down your accounts in an order that aims to improve your after-tax result (2).
- RMDs: set RMDs modeled to Yes to apply age-based Required Minimum Distributions during retirement (3).
You can also set your tax-loss harvesting frequency and whether to max out your yearly Roth contribution here.
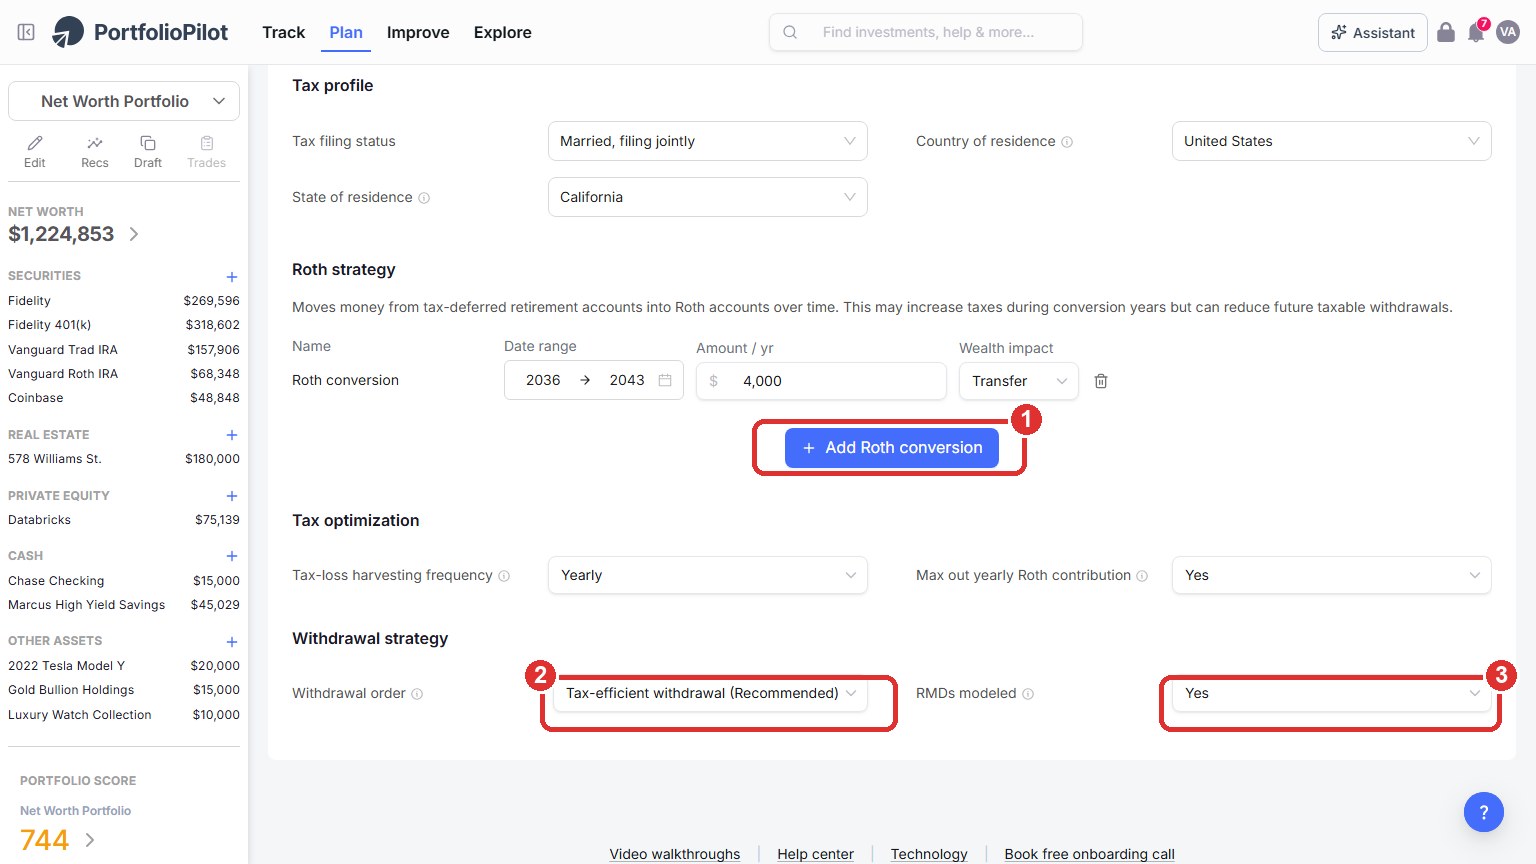
Taxes & withdrawals: Roth conversions, the tax-efficient withdrawal order, and the RMDs modeled toggle.
Model settings: inflation
On the Model settings tab, set the Inflation assumption (1). This is the yearly rate the planner uses to grow your future expenses and income, so it affects every projection. The default is a reasonable long-run estimate; raise it to stress-test a higher-inflation future or lower it to model a calmer one.
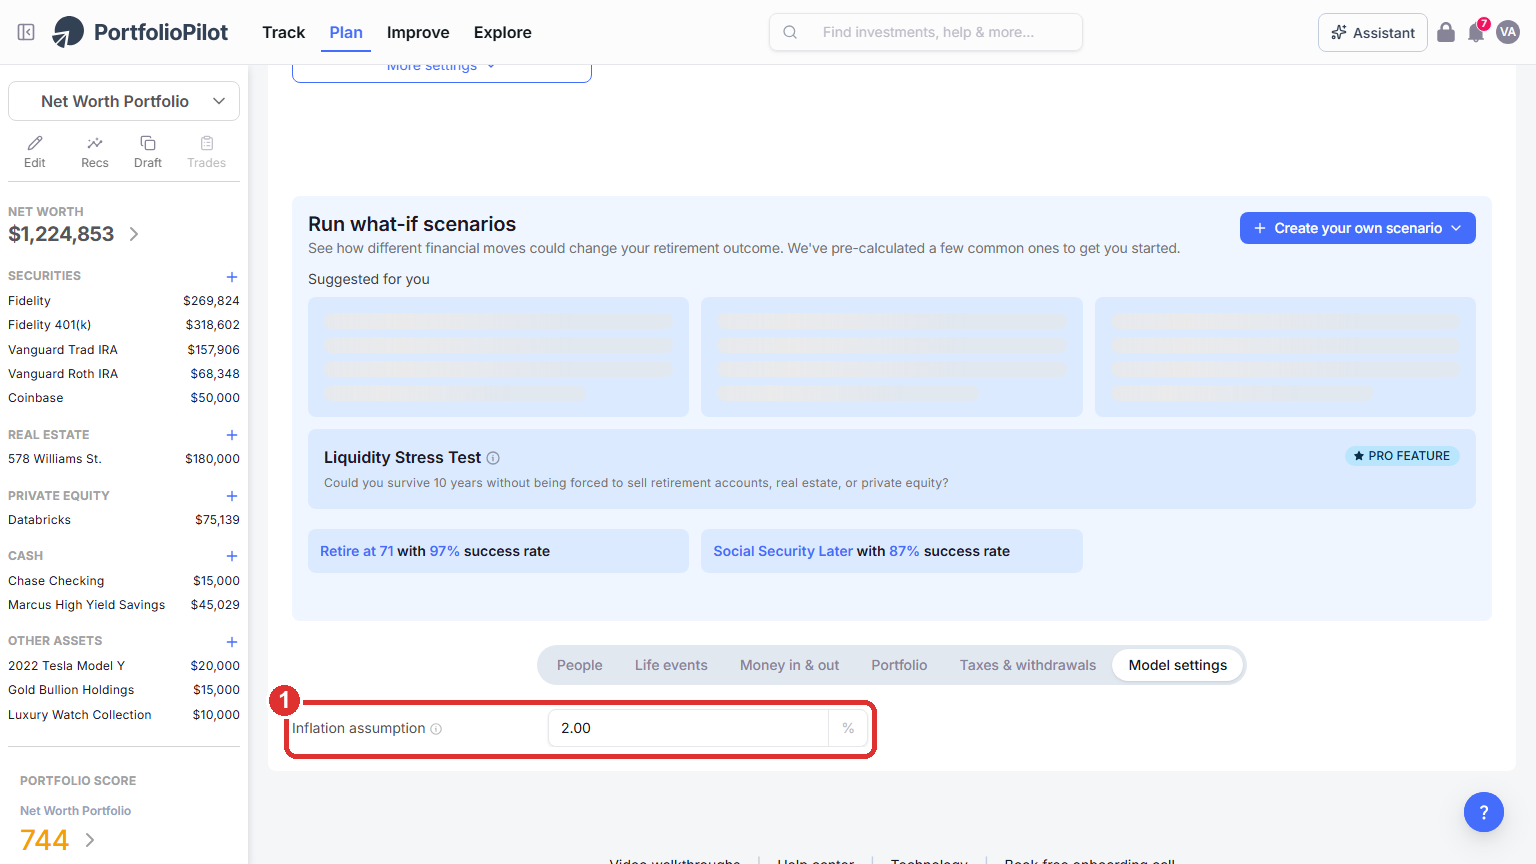
Model settings: the inflation assumption used to grow future expenses and income.
Run what-if scenarios
Below the chart, Run what-if scenarios shows how different financial moves could change your outcome:
- Suggested for you: PortfolioPilot pre-calculates a few common moves and shows each one's projected impact, for example raising your Portfolio Score by 100 points, applying monthly tax-loss harvesting, retiring a few years later, or delaying Social Security. Select one to apply it and recalculate (1).
- Create your own scenario: choose Build manually to set your own parameters, or Generate with AI to describe a change in plain language and let the AI Assistant model it for you (2).
For example, you could ask it to "Convert $50,000 per year from a traditional IRA to Roth between ages 60 and 65" and weigh the short-term tax cost against lower future RMDs and the change in your probability of success.
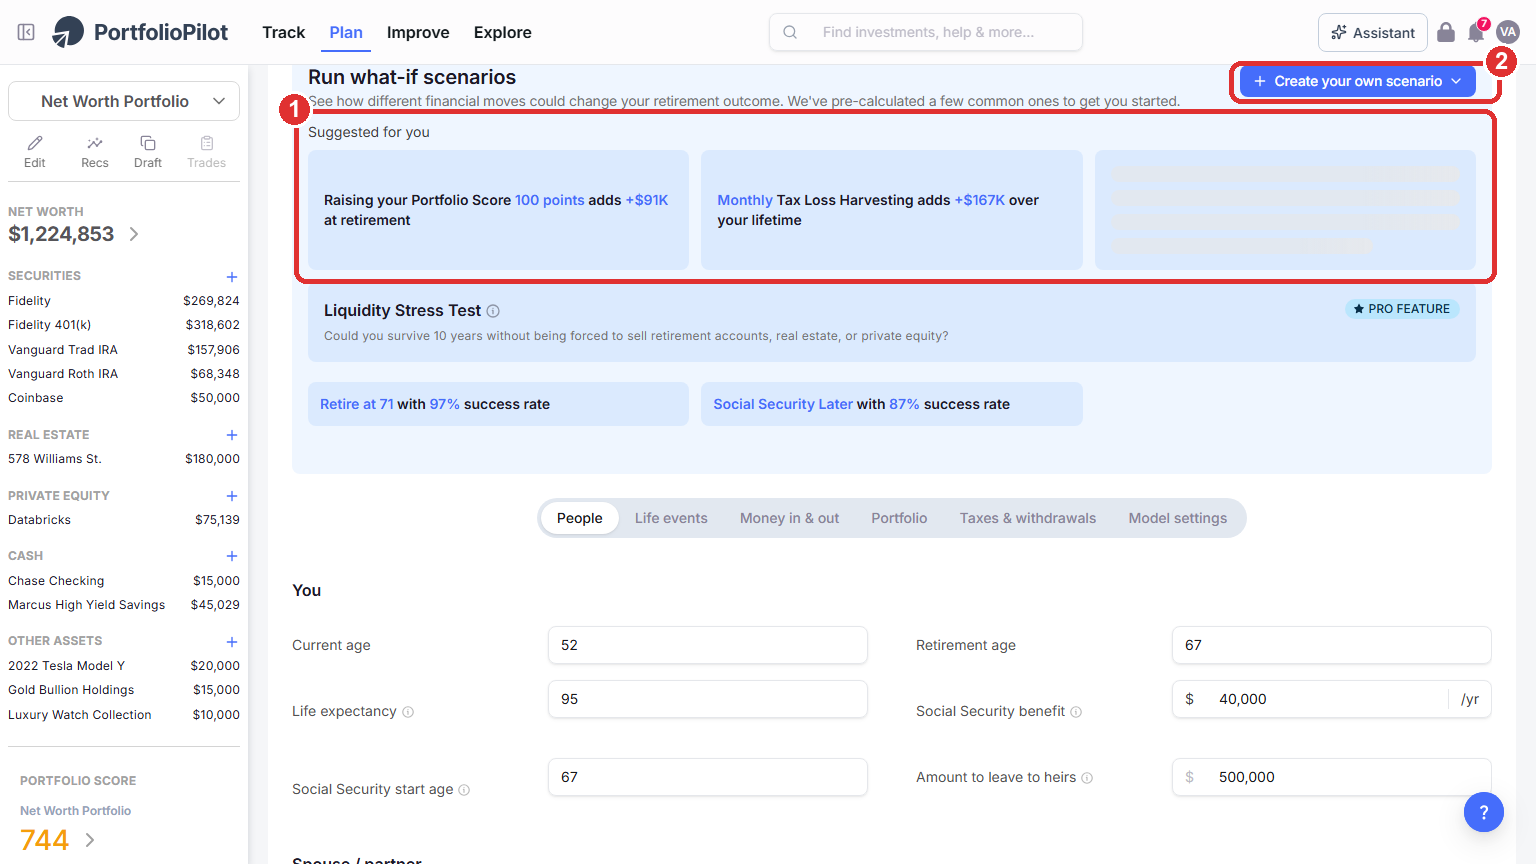
Run what-if scenarios: pre-calculated suggestions, plus your own manual or AI-assisted scenarios. Figures shown are illustrative.
On a phone, the Suggested for you presets (1) and Create your own scenario (2) stack below the chart.
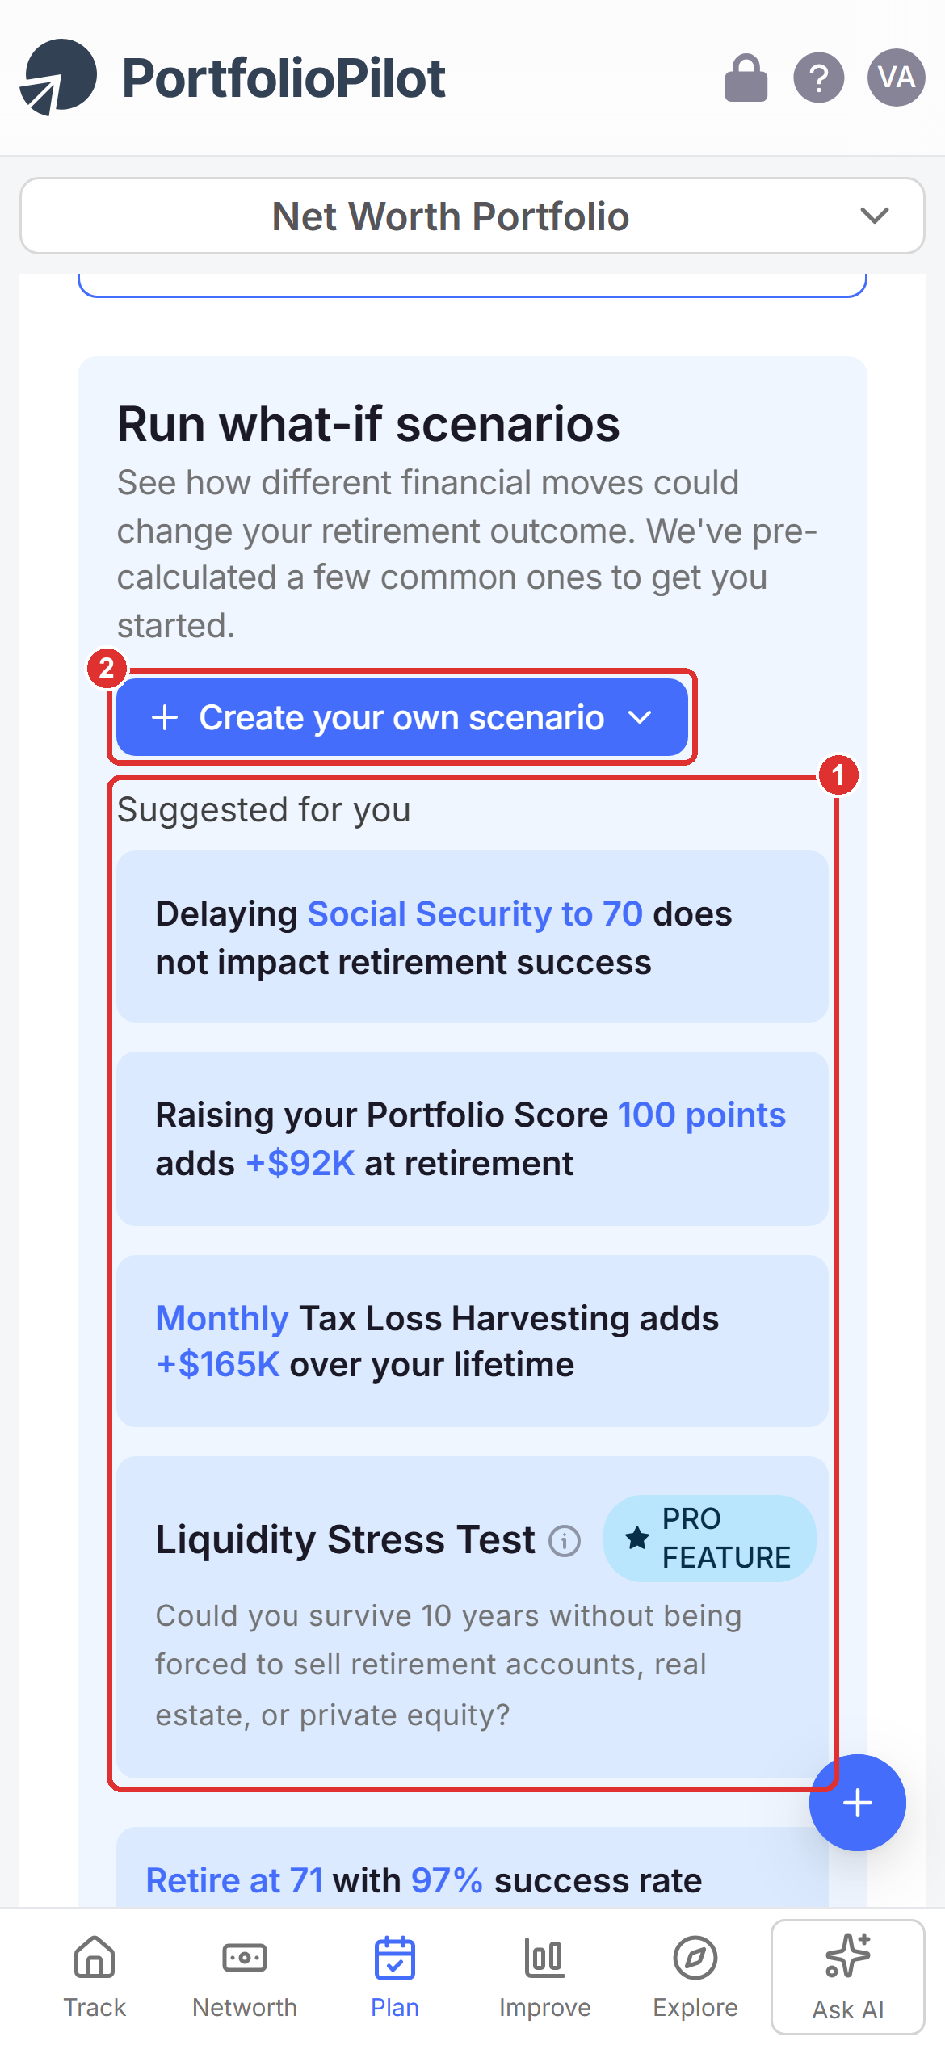
Mobile view: the Suggested for you presets and Create your own scenario. Figures shown are illustrative.
Run the Liquidity Stress Test
The Liquidity Stress Test (a Pro feature) checks whether you could ride out a market downturn without being forced to sell illiquid assets such as retirement accounts, real estate, or private equity (1). It runs 1,000 stress simulations over a 10-year period to estimate whether your liquid assets stay sufficient, whether forced liquidation would be required, and your probability of staying liquid through adverse conditions. It is especially useful if you hold concentrated equity, significant real estate, private investments, or have high spending relative to your liquid assets.
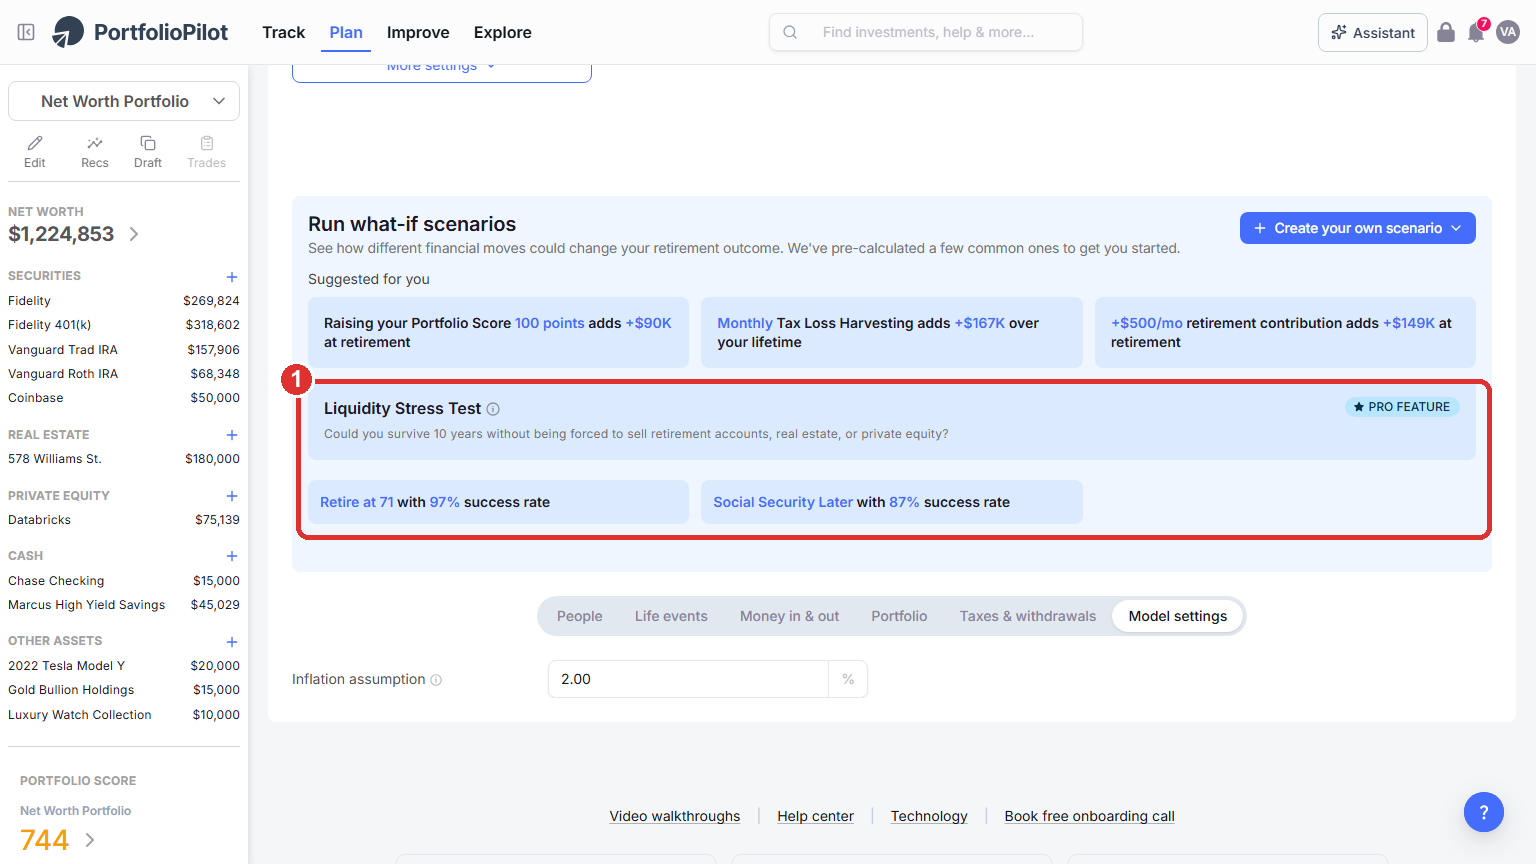
The Liquidity Stress Test (Pro): a 10-year check of whether you would be forced to liquidate. Shown for an example portfolio that holds illiquid assets. Figures shown are illustrative.
Improve your probability of success
Your probability of success is the share of the 1,000 simulations in which your money lasts through your life expectancy. These are the moves people most commonly make to improve it:
- Retire later.
- Save more, by raising your monthly contributions.
- Spend less, by lowering your Monthly retirement budget.
- Adjust your risk levels, before and in retirement.
- Apply tax strategies, such as Roth conversions and the tax-efficient withdrawal order.
- Run a what-if scenario, to compare any of these moves before you commit.
After any change, watch the numbers and the Expected and Poor outcome lines respond. PortfolioPilot does not apply a fixed "safe withdrawal rate"; it stress-tests your actual budget, so the practical way to find a sustainable spending level is to adjust your Monthly retirement budget until your probability of success feels comfortable to you. Your settings save to your PortfolioPilot profile, so as your portfolio grows you can reopen the planner and rerun it against your latest numbers.
The sections that follow, How the planner works, Assumptions and limitations, Common use cases, and Next steps, are background reading rather than steps to complete.
How the planner works
A few details on what happens behind the result:
- Monte Carlo simulations: the planner runs 1,000 possible futures, each with different yearly returns that reflect market volatility, to produce a range of outcomes rather than a single guess.
- Taxed vs tax-advantaged accounts: withdrawals from tax-advantaged accounts (such as IRAs and 401(k)s) are tracked separately from taxed accounts (brokerage, cash, real estate, private equity), where withdrawals are modeled as long-term capital gains using your expected income and country-specific tax tables.
- Balanced withdrawals: in retirement, the model draws across account types in an order that aims to improve your after-tax outcome, factoring in Social Security and other income.
- Success probability: your success rate is the share of the 1,000 simulations that end with a positive balance at your life expectancy.
Common use cases
Can I retire early (FIRE)?
Lower your Retirement age (for example to 45) on the People tab and watch the success probability and the Expected and Poor outcome lines shift, then test saving more or spending less.
Should I do a Roth conversion?
Use Add Roth conversion (or an AI what-if scenario) across, say, ages 60 to 65, and compare the higher taxes now against lower future RMDs and the change in your probability of success.
Could a downturn force me to sell?
Run the Liquidity Stress Test to see whether your liquid assets would cover a 10-year stress period without forced liquidation.
How much can I safely spend?
Raise your Monthly retirement budget (for example from $14,100 to $17,000) and see how far your probability of success falls, then lower it until you reach a level you are comfortable with.
Next steps
- Tutorial: Tax Optimization. Tax-loss harvesting and seeing the tax impact of changes.
- Tutorial: Crisis Simulation. Stress-test your portfolio against historical and custom downturns.
- Tutorial: Personalized Recommendations. Turn your plan into specific, prioritized actions.
Global Predictions provides investment advice only through its internet-based application, PortfolioPilot, and only to individuals who are advisory clients of Global Predictions pursuant to written advisory Client Agreements ("Advisory Services"). The publicly available portions of the Platform (i.e., the sections of the Platform that are available to individuals who are not party to a Client Agreement, including globalpredictions.com and portions of portfoliopilot.com) are provided for educational purposes only and are not intended to provide legal, tax, or financial planning advice. To the extent that any of the content published on publicly available portions of the Platform may be deemed to be investment advice, such information is impersonal and not tailored to the investment needs of any specific person. Nothing on the publicly available portions of the Platform should be construed as a solicitation or offer, or recommendation, to buy or sell any security. All charts, figures, and graphs on the publicly available websites are for illustrative purposes only. Before investing, you should consider whether any investment, investment strategy, security, other asset, or related transaction is appropriate for you based on your personal investment objectives, financial circumstances, and risk tolerance. You are also encouraged to consult your legal, tax, or investment professional regarding your specific situation. Registration does not imply a certain level of skill or training. Investing involves risk. The value of your investment will fluctuate, and you may gain or lose money.
The contents of the Platform may contain forward-looking statements that are based on management's beliefs, assumptions, current expectations, estimates, and projections about the financial industry, the economy, or Global Predictions itself. Forward-looking statements are not guarantees of the underlying expected actions or future performance and future results may differ significantly from those anticipated by the forward-looking statements. Therefore, actual results and outcomes may materially differ from what may be expressed or forecasted in such forward-looking statements.
Case studies presented are hypothetical scenarios and intended for illustrative purposes only. They do not represent an actual client, investment or experience, but rather are meant to provide an example of the intended investment process and methodology. An individual's experience may vary based on his or her circumstances. There can be no assurance that the Firm will be able to achieve similar results in comparable situations. No portion of this case study is to be interpreted as a testimonial or endorsement of the Firm's investment advisory services. The information contained herein should not be construed as personal investment advice.
Note: our use of the term AI refers to all artificial intelligence models used including large language models, proprietary economic models that incorporate regression or dynamic factors, and machine learning methods like supervised learning. For more information, see our disclosures at globalpredictions.com/disclosures.
Retirement and scenario planning are part of the free plan. The Liquidity Stress Test is a Pro feature, and deeper optimization such as investing recommendations and tax-loss harvesting is available with Gold, Platinum, or Pro (all with a 10-day free trial, no credit card required).
