
Is the 60/40 Portfolio Still Alive in 2025?

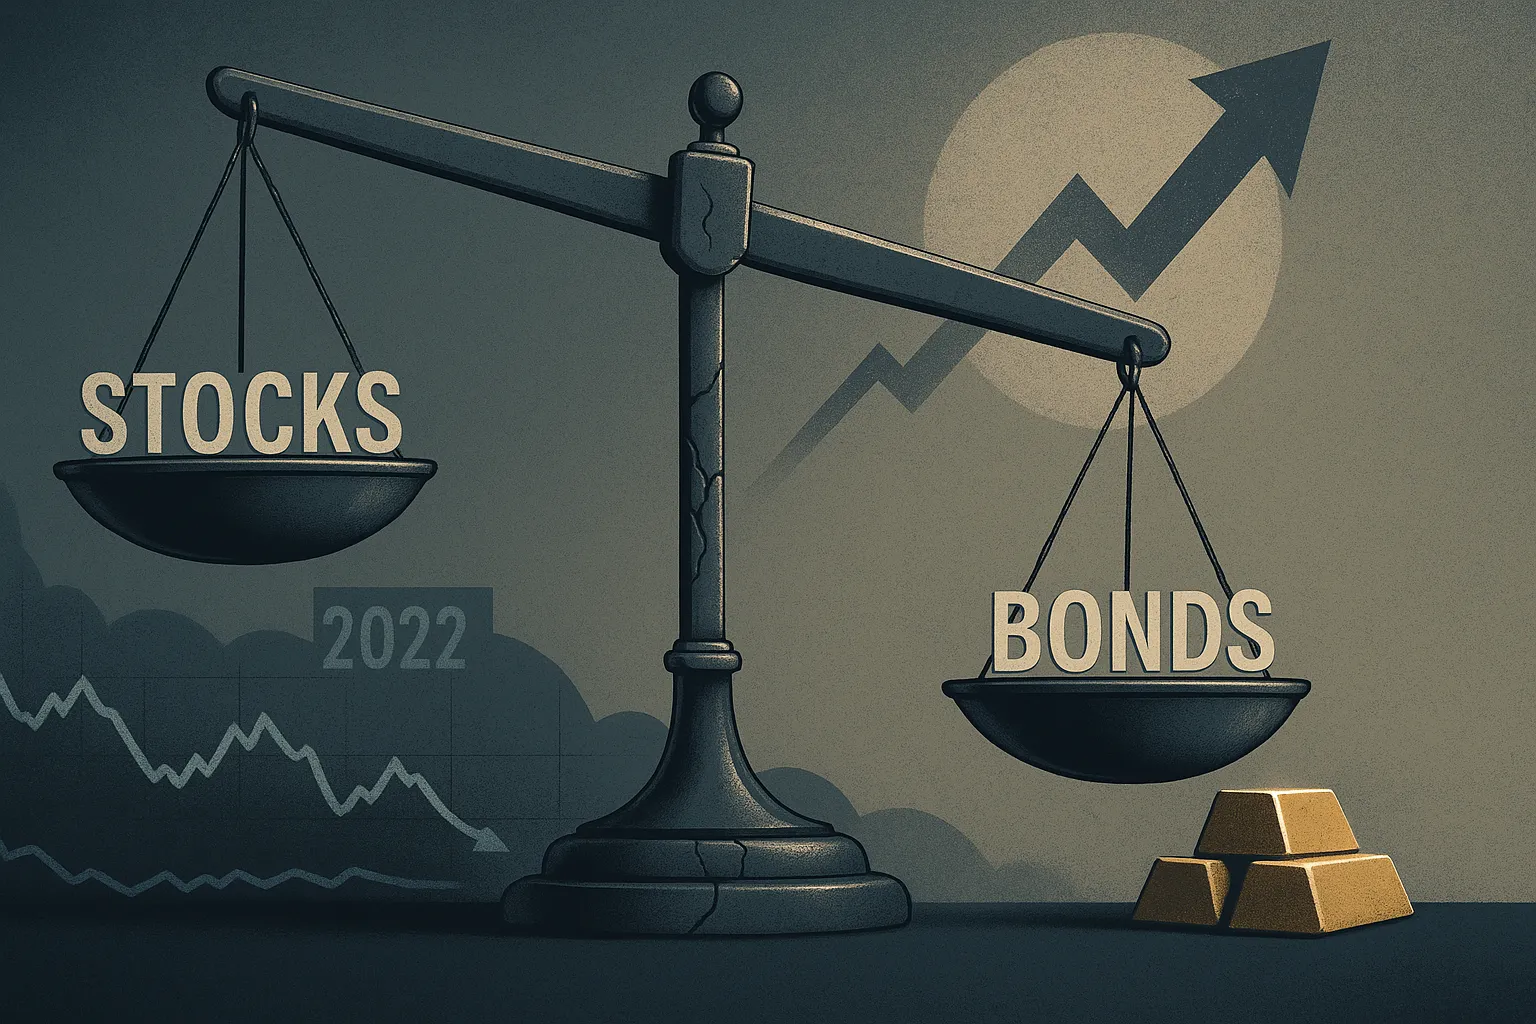
According to Morningstar, the classic 60/40 portfolio of US stocks and bonds fell more than 16% in 2022—its sharpest drop since 2008. But the deeper story is that this wasn’t just a bad year. From 2021 to mid-2023, the 60/40 strategy delivered its worst stretch of underperformance in 150 years, driven largely by bond losses during a period of aggressive rate hikes and inflation. For many investors, this broke a fundamental assumption: that bonds reliably cushion equity downturns. But in a high-inflation, rising-rate environment, both asset classes sank together. So is the 60/40 portfolio dead in 2025—or just due for reinvention?
The article unpacks why the strategy may still have value, when it breaks down, and how it’s being adapted in today’s volatile market.
Key Takeaways
- The classic 60/40 mix suffered a historic drawdown in 2022 due to inflation and rate shocks.
- The strategy may still work—but only if assumptions about bonds, diversification, and risk are updated.
- Some investors are adding alternatives, international exposure, or factor tilts to adapt.
- Behavioral discipline matters more than precise allocation models.
- Tools like diversification scoring or stress-test modeling can help assess durability in today's market.
Why the 60/40 Broke Down
The 60/40 portfolio—60% equities, 40% fixed income—has long been a default for balanced investing. Historically, bonds offered income and stability during stock selloffs. That inverse relationship worked well in decades when inflation was low and rates trended downward.
World Economic Forum analysis shows the Fed’s rate hikes from March to December 2022 were the steepest in over 30 years—nearly twice the pace of the 1988–89 tightening cycle. Inflation peaked above 9% (BLS, 2022). As a result, bond prices fell sharply, alongside equity markets. The two pillars of the 60/40 both cracked.
This revealed a key vulnerability: correlation risk. When markets are hit by a macro shock—like inflation—diversification can break down. Bonds may no longer be the counterweight many assume they are.
So what happens to a model that assumes they are?
- Hypothetical: Imagine a 38-year-old investor rebalancing quarterly into a 60/40 mix through 2022. As both assets drop, the rebalancing buys into weakness—but without the usual bond support. The loss compounds, and the investor begins questioning the entire strategy.
For some, this was a wake-up call that asset allocation models need to reflect the macro regime, not just historical averages.
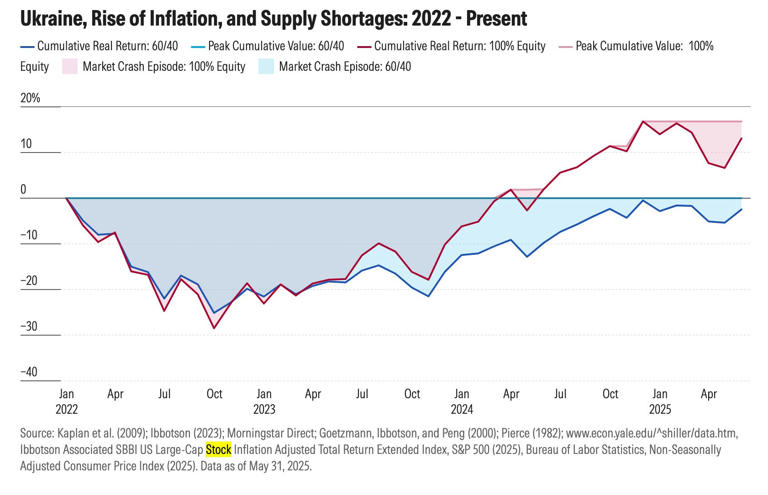
The chart below illustrates how both equities and bonds suffered simultaneously through 2022–2023, challenging the assumption that bonds act as reliable ballast in diversified portfolios.
It's Not Dead—Just Dated
Despite its challenges, the 60/40 portfolio isn't obsolete. But it's no longer one-size-fits-all. The real question isn't whether the strategy works, but under what conditions.
- When inflation is stable and rates are predictable, 60/40 may still offer a reasonable balance of growth and protection.
- When inflation is volatile or negative correlations break down, the mix can underperform.
Some investors are adapting with modest changes:
- Adding Treasury Inflation-Protected Securities (TIPS) to hedge real rate risk
- Including commodities or real assets for inflation exposure
- Diversifying globally to capture growth beyond the U.S.
- Using factor strategies like low volatility or value tilt
The point isn’t to throw out the framework. It’s to reexamine the assumptions that once made it work.
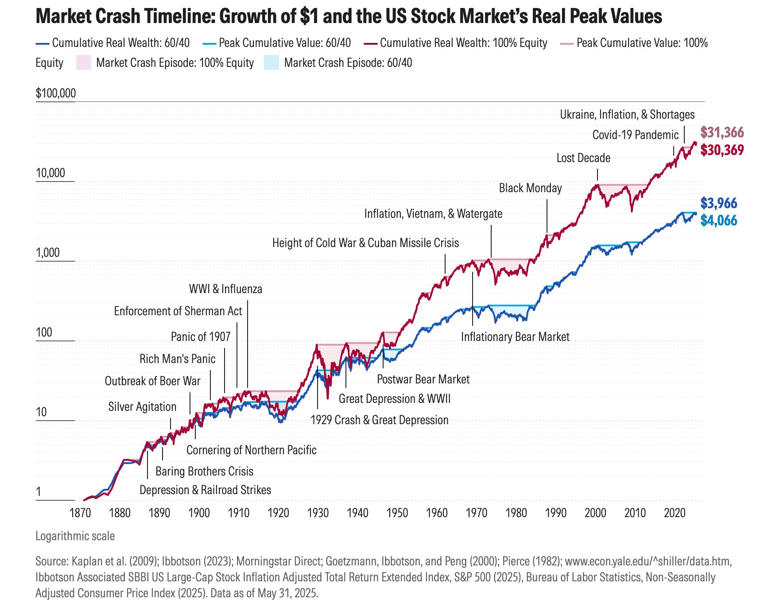
Despite short-term pain, the long arc of history still favors diversified strategies. The chart below shows how both 60/40 and 100% equity portfolios have delivered substantial long-term gains—even through wars, inflationary shocks, and recessions.
Still, the recent divergence highlights why investors are questioning whether past models still apply in the current macro regime.
Behavior Still Matters More Than Models
In practice, allocation discipline often matters more than allocation precision. During drawdowns, many investors panic-sell—locking in losses and derailing long-term plans. A diversified strategy like 60/40 only works if followed consistently.
That makes behavioral compatibility a feature, not a flaw. Even if 60/40 isn’t optimal on paper, it may be optimal for investors who need simplicity and consistency. Similarly, the cost of complexity—chasing tactical changes, adding too many asset classes, or timing macro trends—can often outweigh the gains.
Put differently: the best strategy is one that’s durable under pressure.
How to Stress-Test It
Some investors are now evaluating portfolios less by historical returns and more by scenario durability. In this framework, tools like:
- Diversification scoring (how uncorrelated assets actually behave)
- Historical drawdown simulations (how portfolios performed in stress years like 2008 or 2022)
- Forward-looking scenario modeling (how inflation or rate shocks affect real returns)
can help assess whether a portfolio’s mix is built to endure shocks.
Chasing the perfect allocation is a distraction. Rebalancing within an imperfect, but behaviorally sustainable, strategy is more likely to succeed long-term.
FAQs
Q: How much did a simple U.S. 60/40 lose in 2022?
A: Using Morningstar’s 2022 totals—U.S. Market −19.4% and U.S. Core Bond −12.9%—a naïve 60/40 implies about −16.8%, the steepest since 2008. Some investors compare against their own fund costs and tracking. Verify with your specific fund’s 2022 report.
Q: Were 2021–mid-2023 unusually bad for 60/40 by long-term history?
A: Morningstar’s 150-year stress test highlights the early-2020s as the only crash where a 60/40 drawdown exceeded an all-equity drawdown—an historically rare stock-bond tandem decline. Check the study’s methodology for index choices.
Q: Did bonds fail to hedge stocks because the Fed hiked unusually fast?
A: Yes. The 2022 rate-hike cycle was the fastest in decades—nearly twice the pace of 1988–89—pressuring both bonds and equities. Pair this with the CPI spike for context.
Q: When did U.S. inflation peak during that period?
A: CPI peaked at 9.1% year-over-year in June 2022, the largest 12-month increase since November 1981. Some investors also track core CPI and PCE for a fuller view.
Q: How did core bonds themselves fare in 2021–2022?
A: Morningstar notes the Bloomberg U.S. Aggregate posted back-to-back calendar-year losses for the first time on record (since 1974) across 2021–2022—an unprecedented bond slump.
Q: What’s the current interest-rate sensitivity of a broad U.S. bond core?
A: iShares AGG reports effective duration of ~5.9 years (June 30, 2025). Duration changes over time; check the latest fact sheet for your specific fund.
Q: Did market concentration reduce diversification benefits recently?
A: S&P Global reports top-10 weight metrics near multi-decade highs, and their research notes equal-weight often outperforms after concentration peaks—implications for diversification scoring.
Q: How did the S&P 500 itself perform in 2022?
A: S&P 500 total return was about −18% in 2022 (price −19.44%, dividend +1.33%). Pair with bond figures to contextualize 60/40 outcomes.
Q: What does rigorous rebalancing actually achieve?
A: Vanguard research frames rebalancing primarily as risk control; across reasonable rules, risk-adjusted returns are similar, while thresholds can reduce costs versus strict calendars. Implementation and taxes matter.
Q: Did 60/40 rebound after 2022’s drawdown, and how does 2023 compare to 2019?
A: Morningstar data shows 2023 was the best calendar year for 60/40 since 2019, indicating meaningful recovery—though regime risk remains a wildcard.
Q: During the 2000–02, 2008, and early-2020 equity sell-offs, how did the Morningstar US Core Bond Index behave versus 2022?
A: In those past crashes, the Morningstar US Core Bond Index delivered positive returns. In contrast, in 2022 it fell about 11.5% year-to-date.
Q: For U.S. inflation protection, which instrument is often considered, and which gauge does it reference?
A: Investors often turn to TIPS (Treasury Inflation-Protected Securities), which reference the CPI—9.1% year over year in June 2022.
Q: How did Morningstar characterize the bond market required for 60/40 to underperform all-equity during a crash?
A: Morningstar described it as one of the worst bond markets in history—so bad that it made a 60/40 more painful than an all-equity portfolio in a crash.
Q: What does World Economic Forum’s comparison of 2022 versus 1988–89 rate-hike speed suggest about stock–bond correlation risk?
A: With hikes nearly twice as fast as those in 1988–89, the correlation between stocks and bonds can flip positive—undermining 60/40’s protective cushion.
Q: What period did Morningstar identify as the worst multi-year stretch for 60/40 relative to all-equity, and what drove it?
A: Morningstar points to 2021 through mid-2023 as the most challenging multi-year period—driven mainly by bond underperformance amid inflation and rapid rate hikes.
Q: For stress-testing a U.S. portfolio against an inflation shock akin to June 2022, which datasets are relevant?
A: Use CPI data for inflation magnitude (e.g., 9.1% in June 2022) and Morningstar bond/equity index returns to assess impact. Factor in the 2022’s hiking-pace regime (nearly twice 1988–89 speed) for context.
Q: In 2022, how could quarterly rebalancing into a U.S. 60/40 have compounded losses?
A: With both stocks (–19%) and bonds (–13%) declining, rebalancing into the weaker asset would simply buy more into a falling market—amplifying drawdowns.
How optimized is your portfolio?
PortfolioPilot is used by over 30,000 individuals in the US & Canada to analyze their portfolios of over $30 billion1. Discover your portfolio score now:

Analyze your entire net worth
360° portfolio analysis, AI Assistant, and personalized recommendations guided by our Economic Insights Engine.


Global Predictions provides investment advice only through its internet-based application, PortfolioPilot, and only to individuals who are advisory clients of Global Predictions pursuant to written advisory Client Agreements ("Advisory Services"). The publicly available portions of the Platform (i.e., the sections of the Platform that are available to individuals who are not party to a Client Agreement - including globalpredictions.com and portions of portfoliopilot.com) are provided for educational purposes only and are not intended to provide legal, tax, or financial planning advice. To the extent that any of the content published on publicly available portions of the Platform may be deemed to be investment advice, such information is impersonal and not tailored to the investment needs of any specific person. Nothing on the publicly available portions of the Platform should be construed as a solicitation or offer, or recommendation, to buy or sell any security. All charts, figures, and graphs on the publicly available websites are for illustrative purposes only. Before investing, you should consider whether any investment, investment strategy, security, other asset, or related transaction is appropriate for you based on your personal investment objectives, financial circumstances, and risk tolerance. You are also encouraged to consult your legal, tax, or investment professional regarding your specific situation. Registration does not imply a certain level of skill or training. Investing involves risk. The value of your investment will fluctuate, and you may gain or lose money.
The contents of the Platform may contain forward-looking statements that are based on management's beliefs, assumptions, current expectations, estimates, and projections about the financial industry, the economy, or Global Predictions itself. Forward-looking statements are not guarantees of the underlying expected actions or future performance and future results may differ significantly from those anticipated by the forward-looking statements. Therefore, actual results and outcomes may materially differ from what may be expressed or forecasted in such forward-looking statements.
Note: our use of the term AI refers to all artificial intelligence models used including large language models, proprietary economic models that incorporate regression or dynamic factors, and machine learning methods like supervised learning.
2. As of February 20, 2025
3. $30B Assets on Platform as of February 20, 2025. Aggregated across all plans (including the free plan). Assets on Platform represent the total value of connected and manually inputted accounts (including assets like real estate and private equity) and does not in any way represent Asset Under Management as Global Predictions does not manage any client funds.
8. Case studies presented are hypothetical scenarios and intended for illustrative purposes only. They do not represent an actual client, investment or experience, but rather are meant to provide an example of the intended investment process and methodology. An individual's experience may vary based on his or her circumstances. There can be no assurance that the Firm will be able to achieve similar results in comparable situations. No portion of this case study is to be interpreted as a testimonial or endorsement of the Firm's investment advisory services. The information contained herein should not be construed as personal investment advice.