
AUM vs Flat Fee Break-Even - Tool

What the tool is for
This tool is a diagnostic. It answers a narrow question: “Given a portfolio value, an AUM fee %, a flat monthly fee, a time horizon, and an optional growth assumption, which structure costs less over time - and when does that flip?” It does not predict returns or recommend a fee model. It simply reveals the long-run arithmetic so a person can weigh cost against services received.
Key Takeaways
- The calculator compares cumulative AUM fees versus a fixed flat subscription over a chosen horizon and growth rate.
- It shows the break-even month when one pricing model becomes cheaper than the other.
- It quantifies the trade-off in dollars (Total savings vs AUM) and as a monthly fee burn now and at the horizon.
Inputs - what each field means (and why it matters)
- Portfolio Value
The current asset level used to compute AUM charges. Larger balances make percentage fees scale up quickly, while a flat fee stays fixed. - AUM Fee (Annual % of Assets)
The annual percentage charged on assets. Many advisors quote a tiered schedule; this field captures the effective rate for the balance evaluated. Industry data indicates AUM remains common, even as alternative pricing grows.(InvestmentNews) - Flat Subscription ($/mo)
A fixed monthly amount that doesn’t scale with assets. Subscription and retainer models have expanded in recent years. (Wealth Management) - Years
The evaluation horizon. Time magnifies small percentage differences into material dollar gaps - one reason the SEC urges investors to examine fee impacts over multi-year periods. (Investor) - Assumed Annual Growth (Optional)
A pre-fee growth assumption is applied to the portfolio for AUM math. It is not a forecast - just a consistent yardstick for comparing fee structures under the same market path.
Outputs - how to read them
- Break-even (Year, Month)
The point at which cumulative flat-fee costs equal cumulative AUM fees. Before this point, one model is cheaper; after it, the other is. - Total savings (vs AUM)
Dollar difference in total fees over the full horizon, positive when the flat fee costs less, negative when AUM costs less. - Monthly fee burn (now)
The present-month cost difference on today’s balance, helpful for quick gut checks. - Monthly fee burn (at horizon)
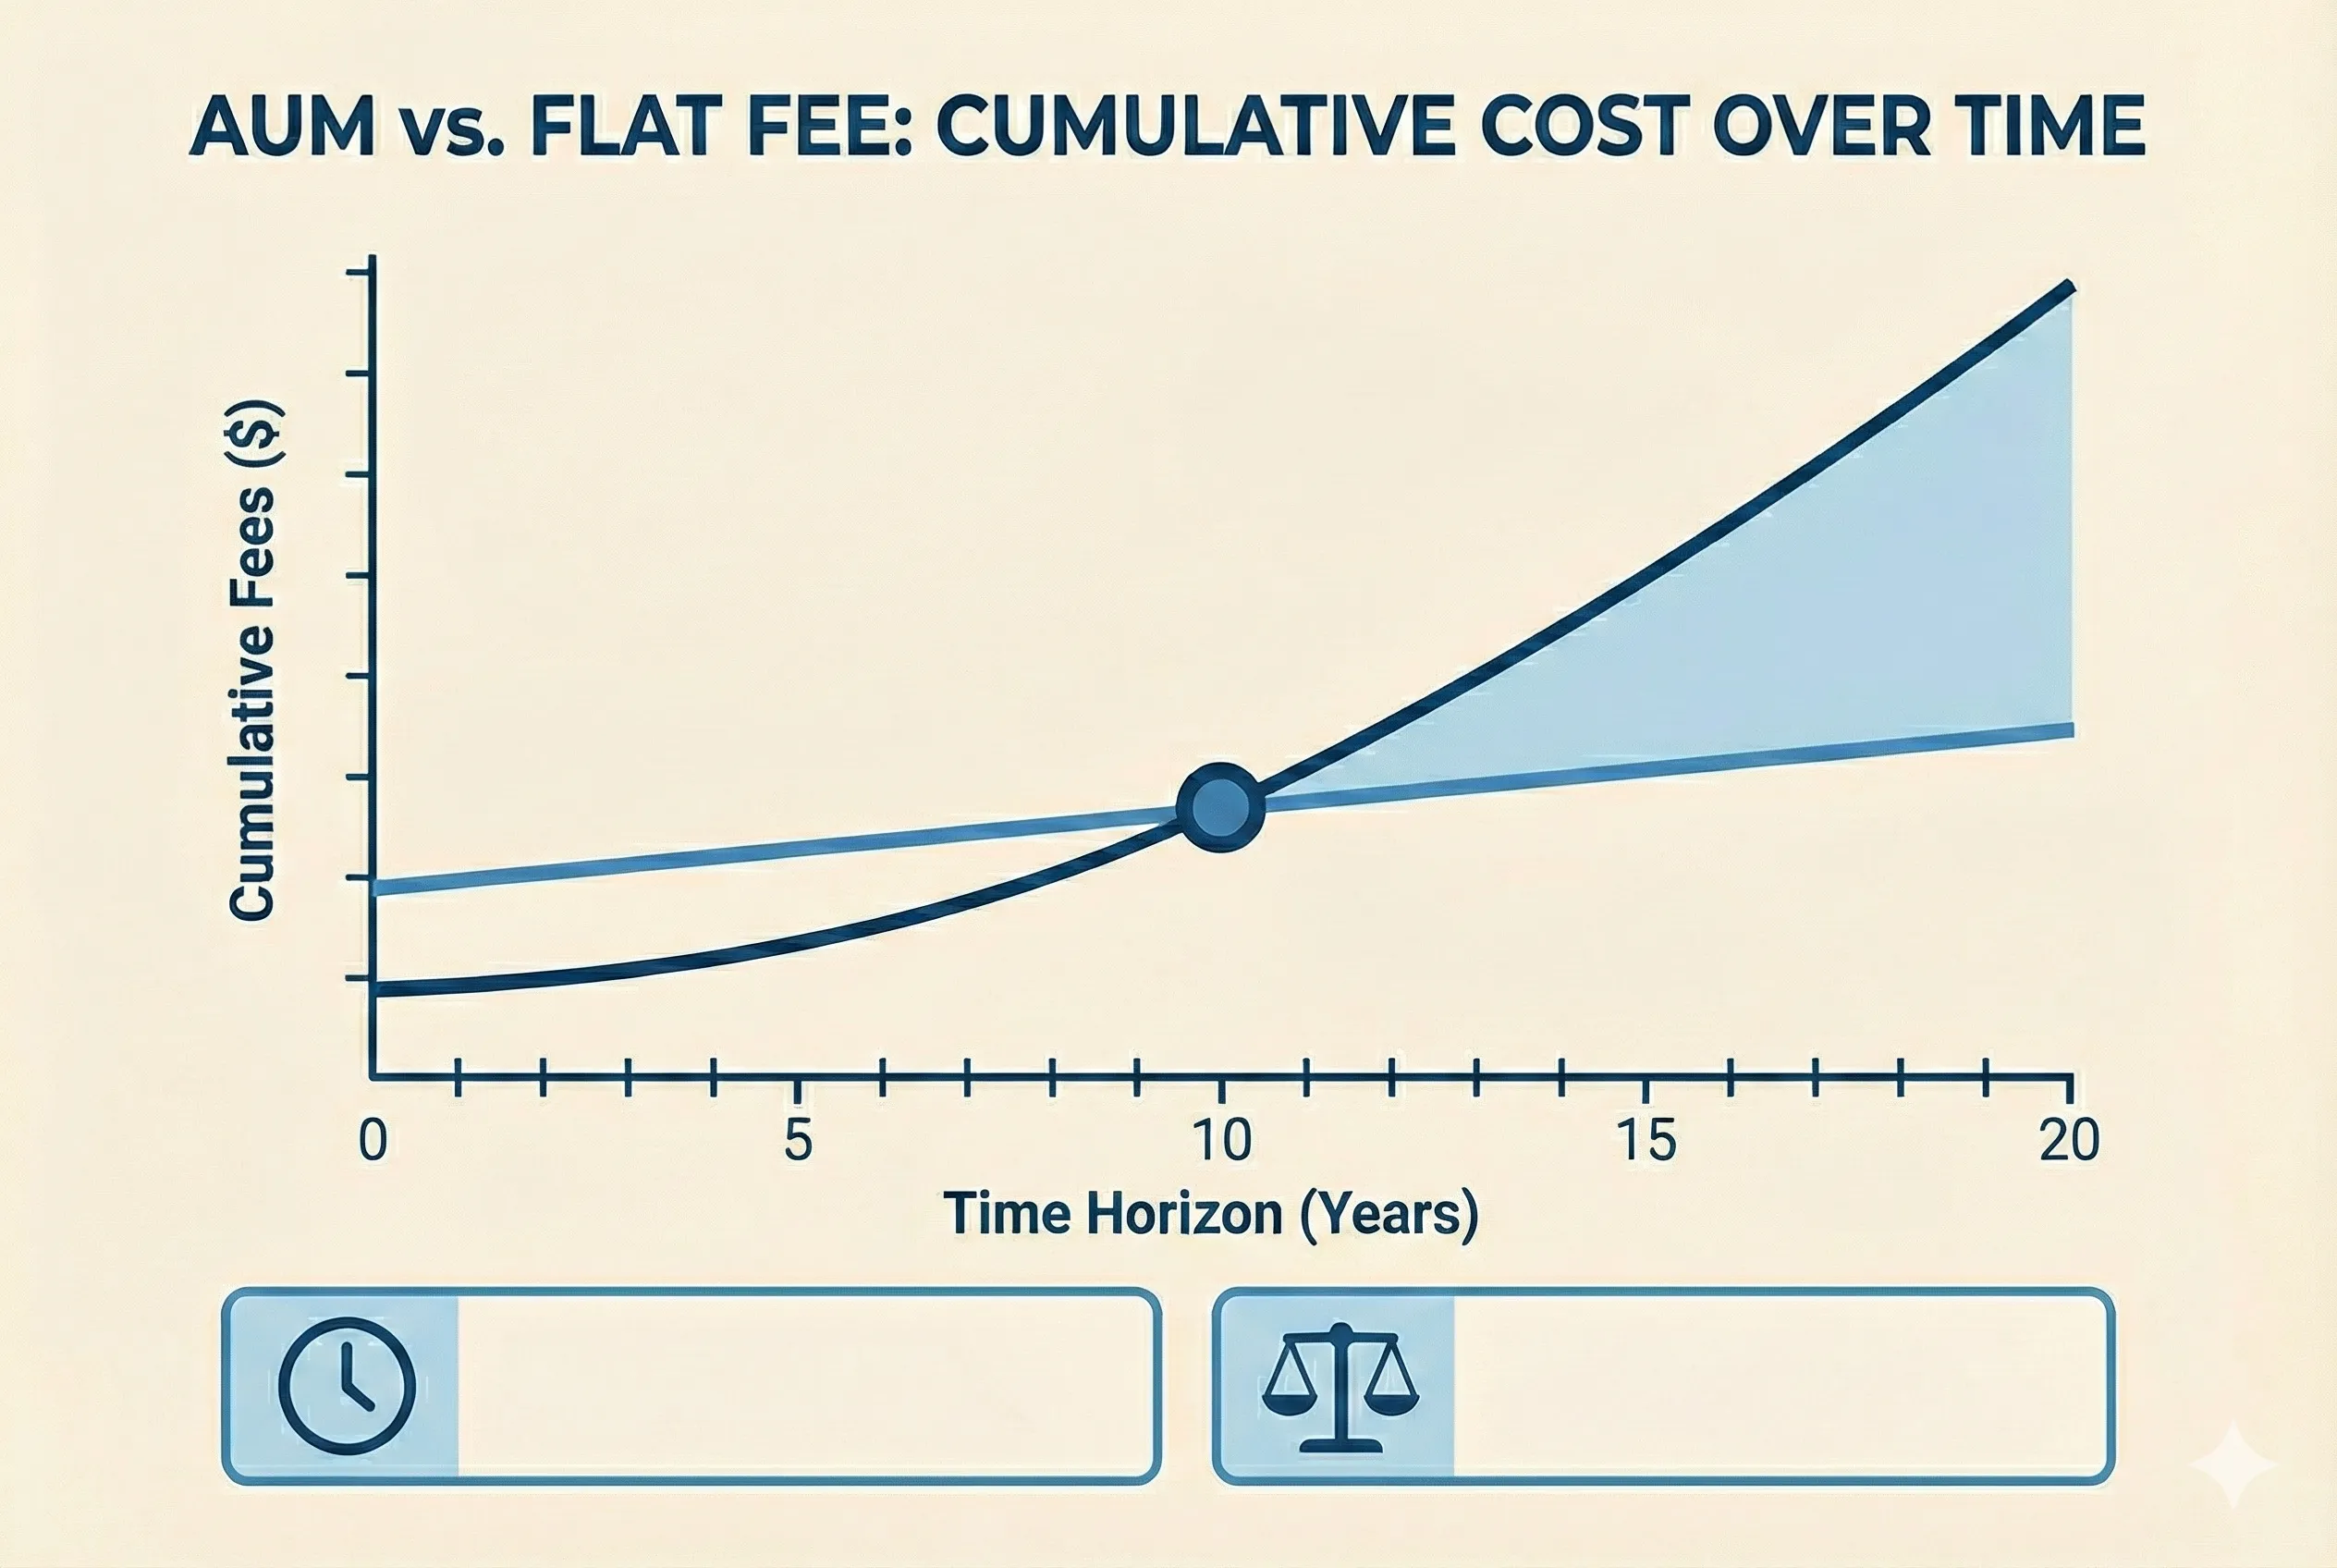
The projected per-month difference at the end of the horizon (after applying the growth assumption) illustrates how compounding assets can tilt the math toward AUM or against it. - Chart: “Cumulative fees: AUM vs Flat”
Two lines show cumulative AUM fees (rising with portfolio size) and cumulative flat fees (a straight slope). The shaded “Flat Savings” makes the cheaper path visually obvious.
How to get useful comparisons (in under two minutes)
- Enter the actual fee terms from an agreement (effective AUM %, actual flat subscription).
- Choose a single conservative growth assumption and keep it consistent across scenarios.
- Focus on the break-even month and Total savings vs AUM - those two numbers tell most of the story.
- Sense-check the Monthly fee burn today vs at the horizon to see how the trade-off evolves as assets change.
This tool is for educational purposes only. It provides a simplified, hypothetical comparison of fee structures using user-entered assumptions. It is not personalized advice, a recommendation of any pricing model, or a prediction of future investment returns or actual fees paid. Results may differ based on portfolio changes, trading activity, fund expenses, taxes, withdrawal patterns, or other factors not included in the model. Investors should consider the full scope of services provided and consult a qualified professional before making financial decisions.
How optimized is your portfolio?
PortfolioPilot is used by over 40,000 individuals in the US & Canada to analyze their portfolios of over $30 billion1. Discover your portfolio score now:


