The Hidden Flaw in Risk-Adjusted Returns: Why Sharpe Ratio Fails in Real-World Investing

Many investors hear about the Sharpe Ratio and assume it’s the gold standard for measuring risk-adjusted returns. It’s taught in finance courses, used by analysts, and praised for helping investors compare portfolios. But what if blindly trusting the Sharpe Ratio could set you up for failure? What if it completely ignores the real risks that can wipe out your investments?
“In terms of how the Sharpe ratio has done in evaluating mutual funds, I would say the answer is poorly.” - Jack Bogle.
The truth is, the Sharpe Ratio can be dangerously misleading. It overlooks major factors like tail risks, market cycles, and liquidity issues—things that matter when markets turn volatile. Many investors rely on it as a shortcut, only to find out the hard way that a high Sharpe Ratio doesn’t always mean an investment is safe.
Key Takeaways
- The Sharpe Ratio measures return relative to volatility, but it ignores tail risks and extreme market events.
- It assumes returns follow a normal distribution, which isn’t always true in real-world investing.
- Market cycles and liquidity risks are not factored in, making some investments look safer than they really are.
- Investors should use additional metrics and qualitative analysis to get a complete picture of risk-adjusted returns.
The Basics of Risk-Adjusted Returns
Risk-adjusted return is a way to measure how much return an investment generates relative to its risk. The most commonly used metric is the Sharpe Ratio, which is calculated as:
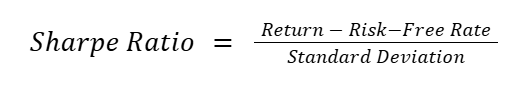
The idea is simple: the higher the ratio, the better the return per unit of risk. But while this sounds logical in theory, it has serious blind spots in practice.
The Hidden Flaws in the Sharpe Ratio
1. It Ignores Tail Risks
One of the biggest issues with the Sharpe Ratio is that it assumes returns are normally distributed. In reality, markets experience fat-tailed distributions, meaning extreme losses happen far more frequently than a normal bell curve would predict.
Check out the chart below to see the difference:
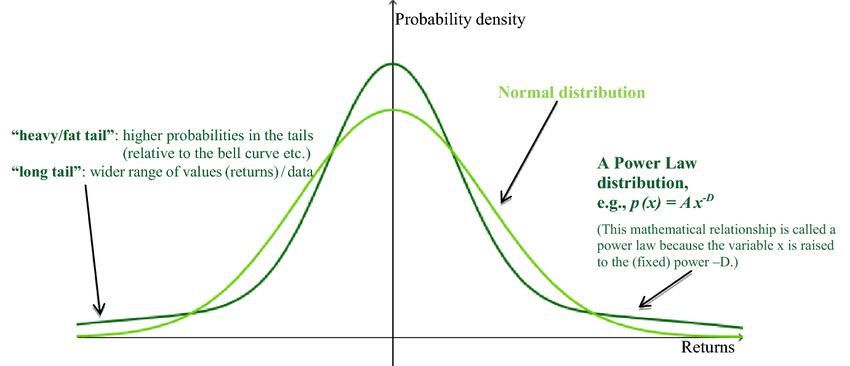
Why does this matter?
- The Sharpe Ratio downplays the impact of major crashes because it assumes extreme returns are rare.
- Events like the 2008 financial crisis or the 2020 pandemic aren’t once-in-a-lifetime anomalies—they happen more often than a normal model predicts.
- Investments with high Sharpe Ratios might look safe, but they often hide massive risks that only show up when markets crash.
2. It Doesn't Account for Market Cycles
The Sharpe Ratio is based on historical data, meaning it isn’t necessarily adjusted for different phases of the market cycle (especially if the history is short).
Hypothetical Example: A fund manager with a great Sharpe Ratio over the past decade might have benefited from a long bull market. But if that fund hasn’t been tested in a bear market, its risk-adjusted return could be completely misleading.
3. Liquidity Risks Are Overlooked
Some investments appear to have low volatility and high Sharpe Ratios simply because they are illiquid. Private equity, real estate, and hedge funds often show artificially low volatility because their prices aren’t marked to market daily.
Hypothetical Example: Two funds report similar Sharpe Ratios, but one invests in highly liquid S&P 500 stocks while the other holds illiquid private assets. The private fund may be much riskier if investors suddenly try to withdraw money during a crisis.
Beyond the Sharpe Ratio: Better Ways to Measure Risk-Adjusted Returns
Given these flaws, investors should not rely on the Sharpe Ratio alone. Here are some alternative metrics to consider:
- Sortino Ratio – Focuses only on downside risk in its volatility calculation, making it more useful for assessing investments that aim to minimize losses.
- Maximum Drawdown – Measures the largest peak-to-trough decline, capturing tail risk better than the Sharpe Ratio.
- Calmar Ratio – Similar to the Sharpe Ratio but uses drawdowns instead of standard deviation.
- Omega Ratio – Considers all moments of return distribution, including skewness and kurtosis, providing a more complete risk assessment.
- Ulcer Index – Measures downside volatility and investor stress, rather than total volatility.
Additionally, qualitative factors like the investment’s strategy, liquidity profile, and ability to withstand market downturns should be part of any analysis.
How optimized is your portfolio?
PortfolioPilot is used by over 30,000 individuals in the US & Canada to analyze their portfolios of over $30 billion1. Discover your portfolio score now:

Analyze your entire net worth
360° portfolio analysis, AI Assistant, and personalized recommendations guided by our Economic Insights Engine.