
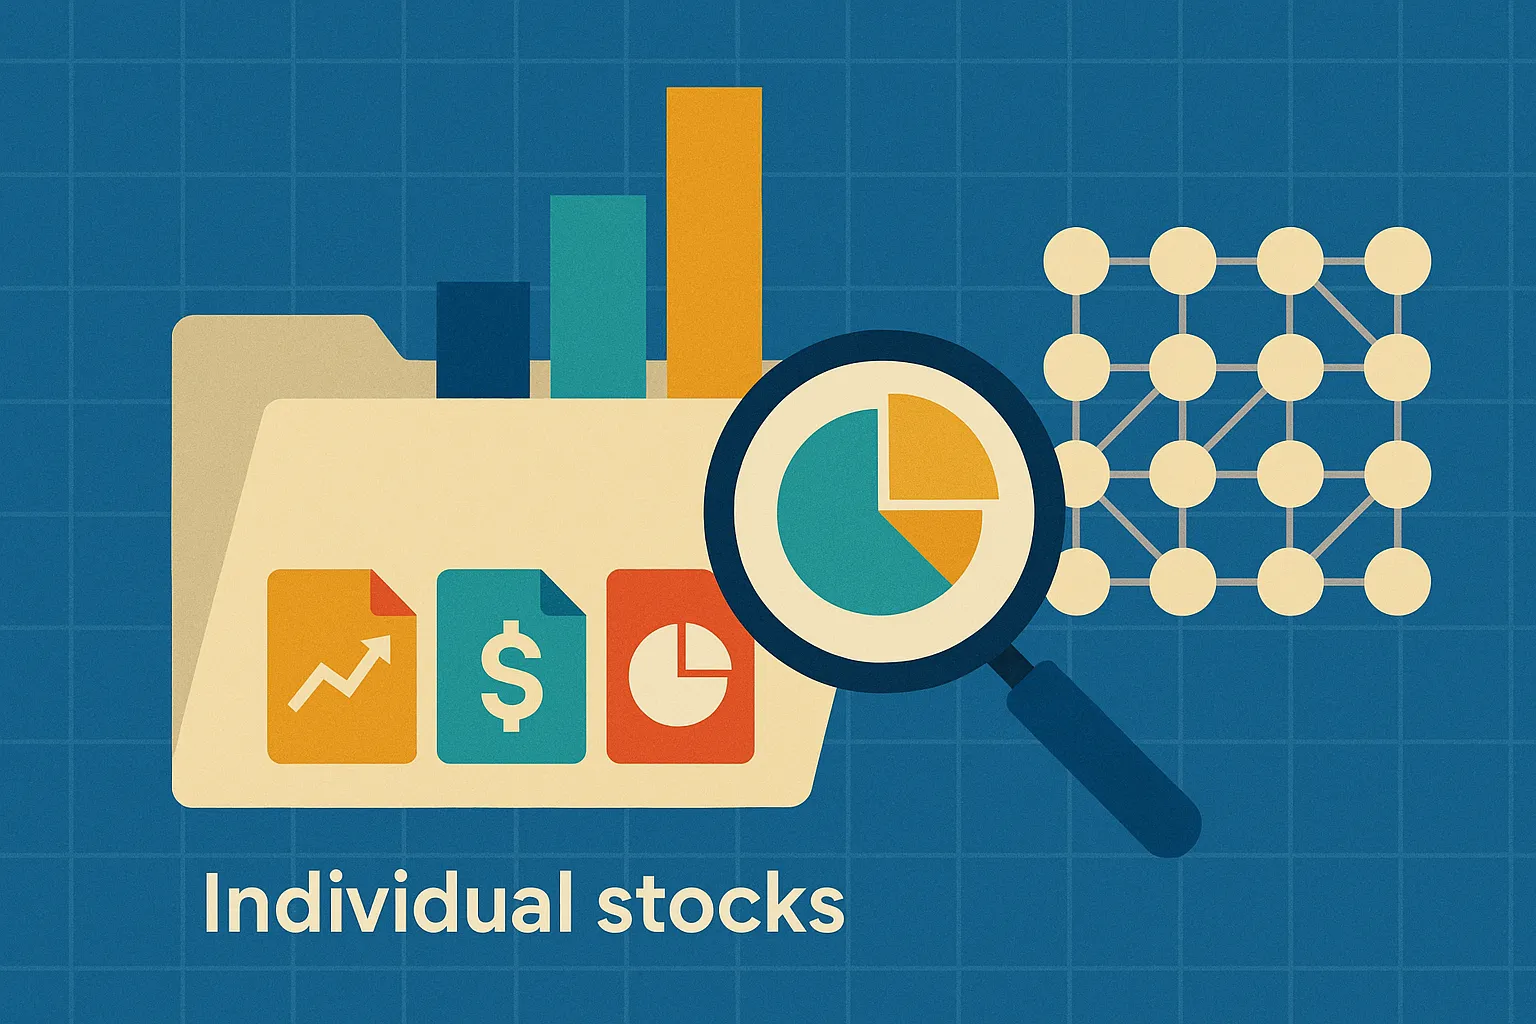
Is the S&P 500 Still Truly Diversified?


According to Morningstar, the top 10 stocks in the S&P 500 now account for over 37% of the index’s total weight—an all-time high as of early 2024 (Morningstar, 2024). For an index often seen as a proxy for broad U.S. market exposure, this level of concentration raises a simple but uncomfortable question: is the S&P 500 still diversified?
Many investors assume that owning an S&P 500 index fund means owning a slice of the whole economy. But the index is market-cap weighted, not equally weighted—meaning larger companies dominate its movements. This article explores how that structure can distort diversification, especially during tech booms or busts.
Key Takeaways
- The top 10 S&P 500 companies represent over a third of its market cap—making it highly top-heavy.
- Sector exposure is skewed: technology and communications now drive much of the index’s performance.
- A market-cap-weighted index inherently concentrates more as certain stocks outperform.
- Diversification by name count does not equal diversification by risk contribution.
- Some investors may consider complementing the S&P 500 with other asset classes or weighting methods.
The Concentration Effect: What the Index Doesn’t Show
The S&P 500 includes 500 companies, but a handful of mega-caps dominate due to market-cap weighting. As of the end of 2024, the top five stocks—Apple, Nvidia, Microsoft, Amazon and Alphabet—made up about 29% of the index. The top ten accounted for roughly 37% of its total weight.
- Hypothetical: Consider an investor who believes they own a balanced portfolio simply because they hold an S&P 500 ETF. In reality, their equity risk is heavily tied to a small number of tech giants. If those companies stumble, the entire portfolio feels it—even if 495 other names stay stable.
From Dot-Com to AI: Tech Dominance Isn’t New
In 2000, at the peak of the dot‑com bubble, technology stocks accounted for approximately 33% of the S&P 500’s market value—one of the highest sector concentrations on record. The S&P 500 then took nearly seven years to fully recover.
Today’s rally is again driven by tech—especially AI-related optimism. While innovation drives growth, history suggests that extreme concentration can backfire if sentiment shifts or regulation tightens.
So what? Relying solely on the S&P 500 means investors may be repeating an old cycle: overexposure to momentum stocks during euphoric periods.
The Hidden Cost of Market-Cap Weighting
Market-cap weighting magnifies winners—and punishes laggards. This creates a feedback loop:
- Winning stocks attract more inflows
- Their weight in the index rises
- Passive funds buy more of them
- Price momentum continues (until it doesn’t)
This structure works well in bull markets, but can be a liability in downturns. For example, in 2022, the S&P 500 fell more than 18%—but the tech-heavy Nasdaq dropped over 30%. Investors in the S&P 500 weren’t immune.
A Market Feature, Not a Flaw?
That said, not everyone views this concentration as a problem. Many analysts argue that the S&P 500’s design naturally rewards strong, established companies—essentially functioning as a dynamic filter for leadership. As underperformers fall in rank, they’re replaced by newer or better-positioned firms, making the index momentum-sensitive by design.
From this perspective, the index isn’t broken—it’s optimized to track where market value and innovation are actually concentrated. For long-term investors, this can provide efficient exposure to the most resilient and competitive players in the U.S. economy.
How Investors Can Stress-Test Diversification
Name count and sector coverage don’t guarantee true diversification. Risk contribution—the share of portfolio volatility driven by individual assets—is a more accurate lens. Some investors may explore alternatives such as:
- Equal-weight S&P 500 ETFs
- Multi-factor funds that reduce exposure to momentum
- Adding non-U.S. equities or real assets
These approaches may help reduce overreliance on a single sector or theme.
The Rebalancing Insight
A simple annual rebalance or position cap (e.g. 5% max per stock) can prevent excessive risk buildup. Behavioral traps—like letting winners grow unchecked—often lead to unintentional concentration.
How optimized is your portfolio?
PortfolioPilot is used by over 30,000 individuals in the US & Canada to analyze their portfolios of over $30 billion1. Discover your portfolio score now:

Analyze your entire net worth
360° portfolio analysis, AI Assistant, and personalized recommendations guided by our Economic Insights Engine.


Global Predictions provides investment advice only through its internet-based application, PortfolioPilot, and only to individuals who are advisory clients of Global Predictions pursuant to written advisory Client Agreements ("Advisory Services"). The publicly available portions of the Platform (i.e., the sections of the Platform that are available to individuals who are not party to a Client Agreement - including globalpredictions.com and portions of portfoliopilot.com) are provided for educational purposes only and are not intended to provide legal, tax, or financial planning advice. To the extent that any of the content published on publicly available portions of the Platform may be deemed to be investment advice, such information is impersonal and not tailored to the investment needs of any specific person. Nothing on the publicly available portions of the Platform should be construed as a solicitation or offer, or recommendation, to buy or sell any security. All charts, figures, and graphs on the publicly available websites are for illustrative purposes only. Before investing, you should consider whether any investment, investment strategy, security, other asset, or related transaction is appropriate for you based on your personal investment objectives, financial circumstances, and risk tolerance. You are also encouraged to consult your legal, tax, or investment professional regarding your specific situation. Registration does not imply a certain level of skill or training. Investing involves risk. The value of your investment will fluctuate, and you may gain or lose money.
The contents of the Platform may contain forward-looking statements that are based on management's beliefs, assumptions, current expectations, estimates, and projections about the financial industry, the economy, or Global Predictions itself. Forward-looking statements are not guarantees of the underlying expected actions or future performance and future results may differ significantly from those anticipated by the forward-looking statements. Therefore, actual results and outcomes may materially differ from what may be expressed or forecasted in such forward-looking statements.
Note: our use of the term AI refers to all artificial intelligence models used including large language models, proprietary economic models that incorporate regression or dynamic factors, and machine learning methods like supervised learning.
2. As of February 20, 2025
3. $30B Assets on Platform as of February 20, 2025. Aggregated across all plans (including the free plan). Assets on Platform represent the total value of connected and manually inputted accounts (including assets like real estate and private equity) and does not in any way represent Asset Under Management as Global Predictions does not manage any client funds.
8. Case studies presented are hypothetical scenarios and intended for illustrative purposes only. They do not represent an actual client, investment or experience, but rather are meant to provide an example of the intended investment process and methodology. An individual's experience may vary based on his or her circumstances. There can be no assurance that the Firm will be able to achieve similar results in comparable situations. No portion of this case study is to be interpreted as a testimonial or endorsement of the Firm's investment advisory services. The information contained herein should not be construed as personal investment advice.