
Tutorial: Portfolio Score
The Portfolio Score answers one question: how healthy is your whole portfolio? It blends three things PortfolioPilot measures about your investments, whether your risk matches your comfort level, whether you are being paid enough for that risk, and how well you are protected against shocks, into a single number from 300 to 850, like a credit score for your portfolio.
It updates as your portfolio and the market move, so you can spot what is holding you back, compare yourself against a benchmark, and see the effect of any change before you make it.
What you'll find in this tutorial
You do not have to follow these in order. Click any section to jump straight to it, or open the Portfolio Score in the app to follow along.
- See your Portfolio Score
- Compare your score to a benchmark
- Why your Portfolio Score changes
- How to improve your Portfolio Score
- Learn more: How the score works, Common use cases, and Next steps.
Throughout, the red markings on each screenshot point to exactly what the text is describing: a (1) in the text matches the 1 badge on the image. Where the phone layout differs, a mobile screenshot follows the desktop one.
See your Portfolio Score
Your Portfolio Score is always in the left sidebar, under your net worth, so it follows you around the app. For the full picture, click it or open Improve, then Portfolio score. At the top of that page you will see your overall score and the band it falls in (for example, 736 (Fair)) (1), and the three components that make it up, each graded out of 10 with its own band such as Excellent or Poor (2). Click any component to open its detail below.
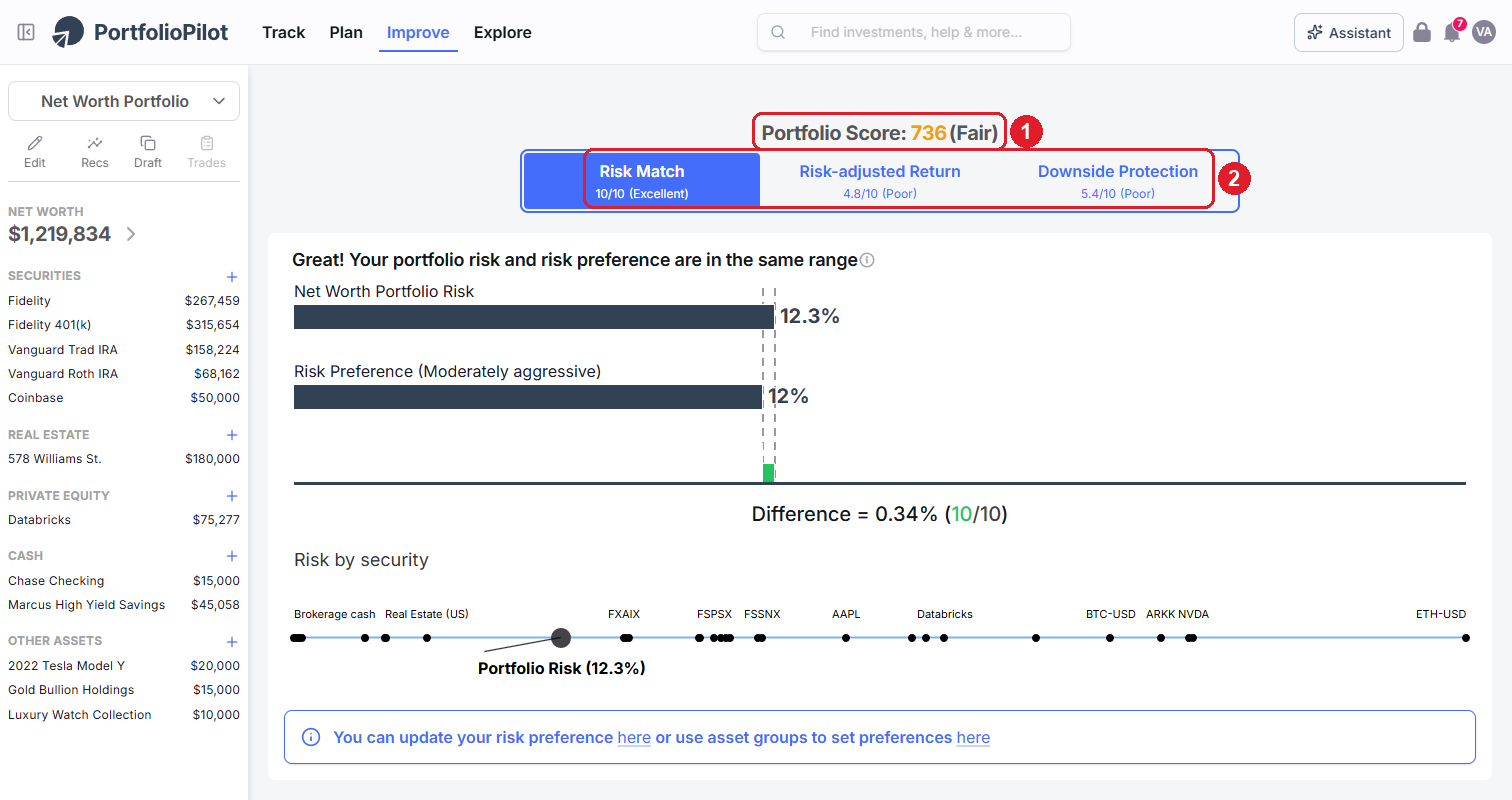
Your overall score (1) combines the three components (2). A strong score in one area cannot fully cover a weak score in another, which is exactly how you find what to work on. Figures shown are illustrative.
Read it like a diagnosis. In the example above, Risk Match is Excellent (10/10) while Risk-adjusted Return (4.8/10) and Downside Protection (5.4/10) are both Poor, so the risk level is well matched, but the portfolio is not being paid enough for its risk and is too exposed to shocks. That tells you where to focus before you read another line.
On a phone, the same overview appears at the top: your Score and band (1) and the three component tabs (2) you can tap to open each one.
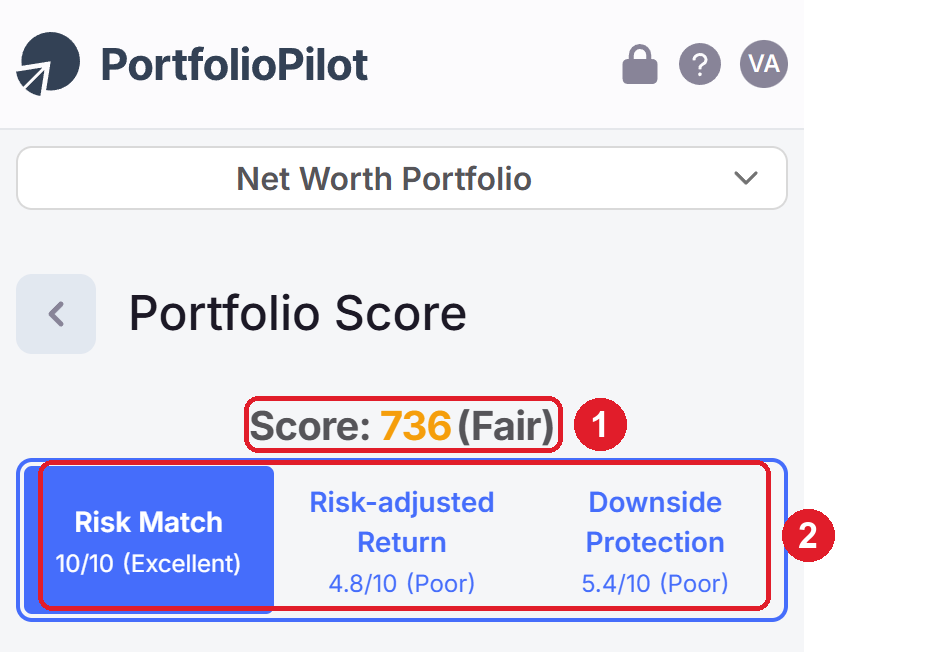
Mobile view: your Score and the three components. Figures shown are illustrative.
Risk Match: are you taking the right amount of risk?
Risk Match compares how risky your portfolio actually is to the risk level you say you want. The closer the two, the higher the score. Taking more risk than you are comfortable with, or less than you need to reach your goals, is one of the most common and most fixable portfolio problems, which is why this is the first component.
Open the Risk Match tab. Two bars compare your portfolio's risk to your preferred risk so you can see the gap at a glance (1): in the example, the portfolio's risk is 12.3% against a Moderately aggressive preference of 12%. That gap becomes your score: a 0.34% difference here scores 10/10 (Excellent) (2).
Below, PortfolioPilot gives you a shortcut to fix a mismatch, a callout that links you to update your risk preference or to use asset groups to set preferences per account (3). The Risk by security line underneath plots where each holding sits on the risk spectrum, so you can see which positions pull your overall risk up or down.
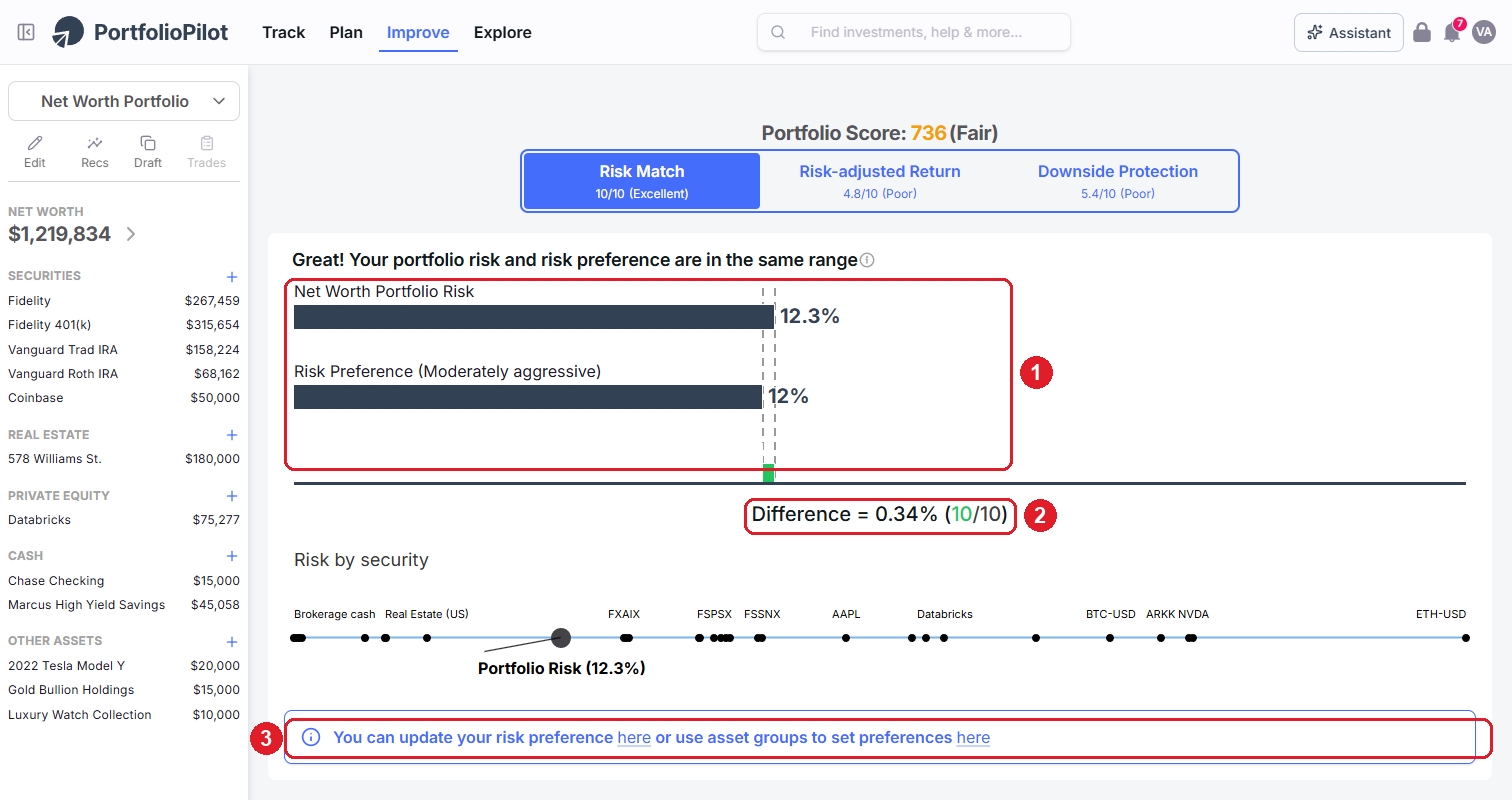
Risk Match shows your portfolio risk against your preference (1) and turns the gap into a score (2). Use the callout (3) to fix a mismatch. Figures shown are illustrative.
How to improve it. There are two levers. If the score is low because your stated tolerance no longer reflects how you want to invest, update your risk preference from the callout.
If your tolerance is right but the portfolio has drifted, adjust the holdings: when your portfolio is riskier than your preference, shift toward lower-volatility assets such as bonds or trim concentrated high-risk positions; when it is too conservative, add growth exposure. You can test either change safely in a Draft Portfolio before you act. Keep in mind that as markets move, your portfolio's risk drifts on its own even if you do nothing, which is the main reason to rebalance periodically.
On a phone, the two risk bars (1) and the Difference score (2) stack below the component tabs.
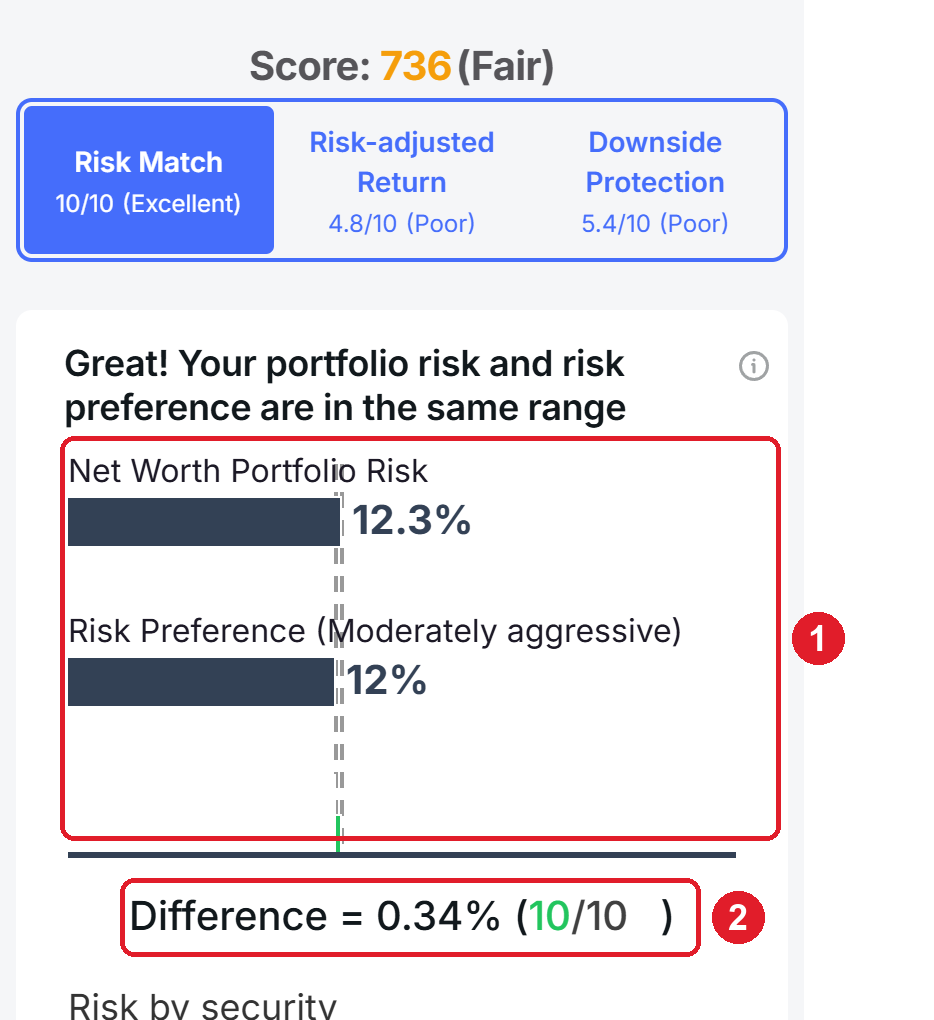
Mobile view: your portfolio risk against your preference, and the resulting score. Figures shown are illustrative.
Risk-adjusted Return: are you being paid enough for your risk?
Risk-adjusted Return is your expected return measured against your portfolio's risk, the Sharpe Ratio. In plain terms: for the amount of risk you are taking, how much reward should you expect? A higher score means you are getting more expected return per unit of risk.
What does "Poor" mean here? A low score, in the example, 4.8/10 (Poor), does not mean your portfolio is losing money or that your holdings are bad. It means you could earn more for the same level of risk.
Open the Risk-adjusted Return tab and PortfolioPilot says exactly that: "You could increase your returns by $115,519 without increasing your risk" (1).
The efficient-frontier diagram makes it visual: the curve is the set of best-possible portfolios at each risk level. "Max at your risk" is the most you could expect to earn at your current risk level (2), and "Your portfolio" sits below it (3). The vertical distance between the two is your room to improve.
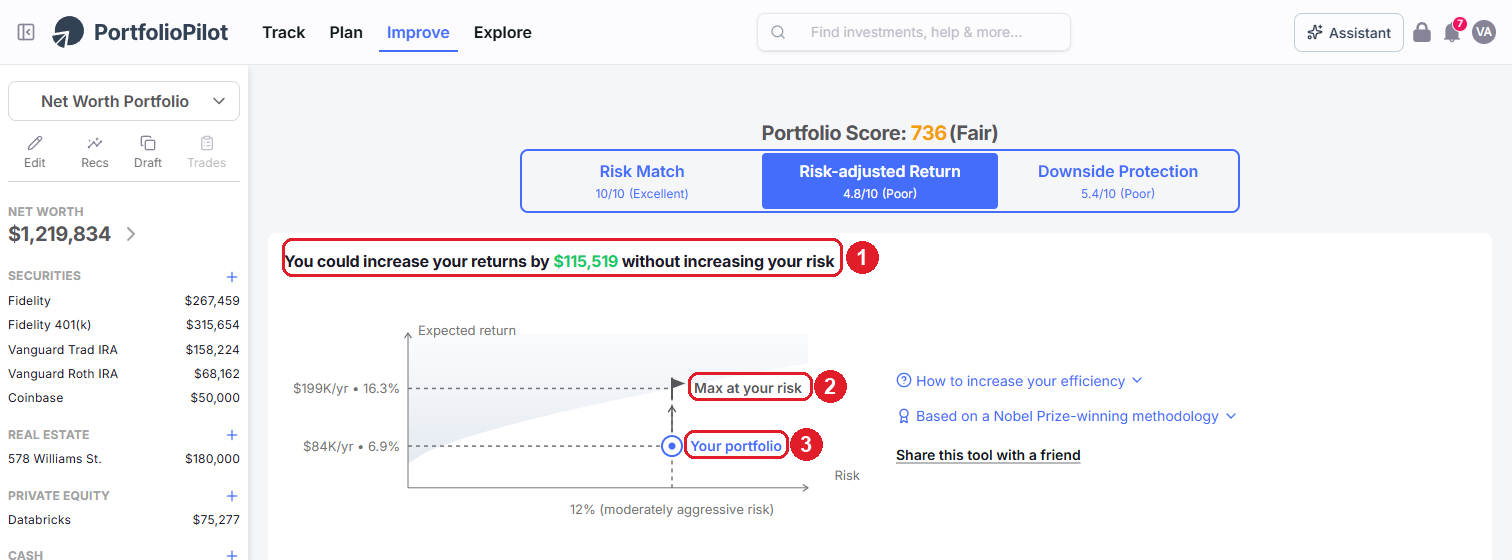
The further your portfolio (3) sits below the maximum at your risk level (2), the lower this score, and the more return the same risk could be earning. Figures shown are illustrative.
How to improve it. The key idea is to treat your portfolio as one connected puzzle, not a pile of separate picks. Holding uncorrelated assets, investments that do not all rise and fall together, lifts your risk-adjusted return without necessarily adding risk. The fastest path is to open Personalized Recommendations, which proposes specific swaps that move you toward the efficient frontier; stage them in a draft and confirm the score rises before you trade.
On a phone, the headline (1) sits above the same efficient-frontier diagram, with Max at your risk (2) and Your portfolio (3) marked on it.
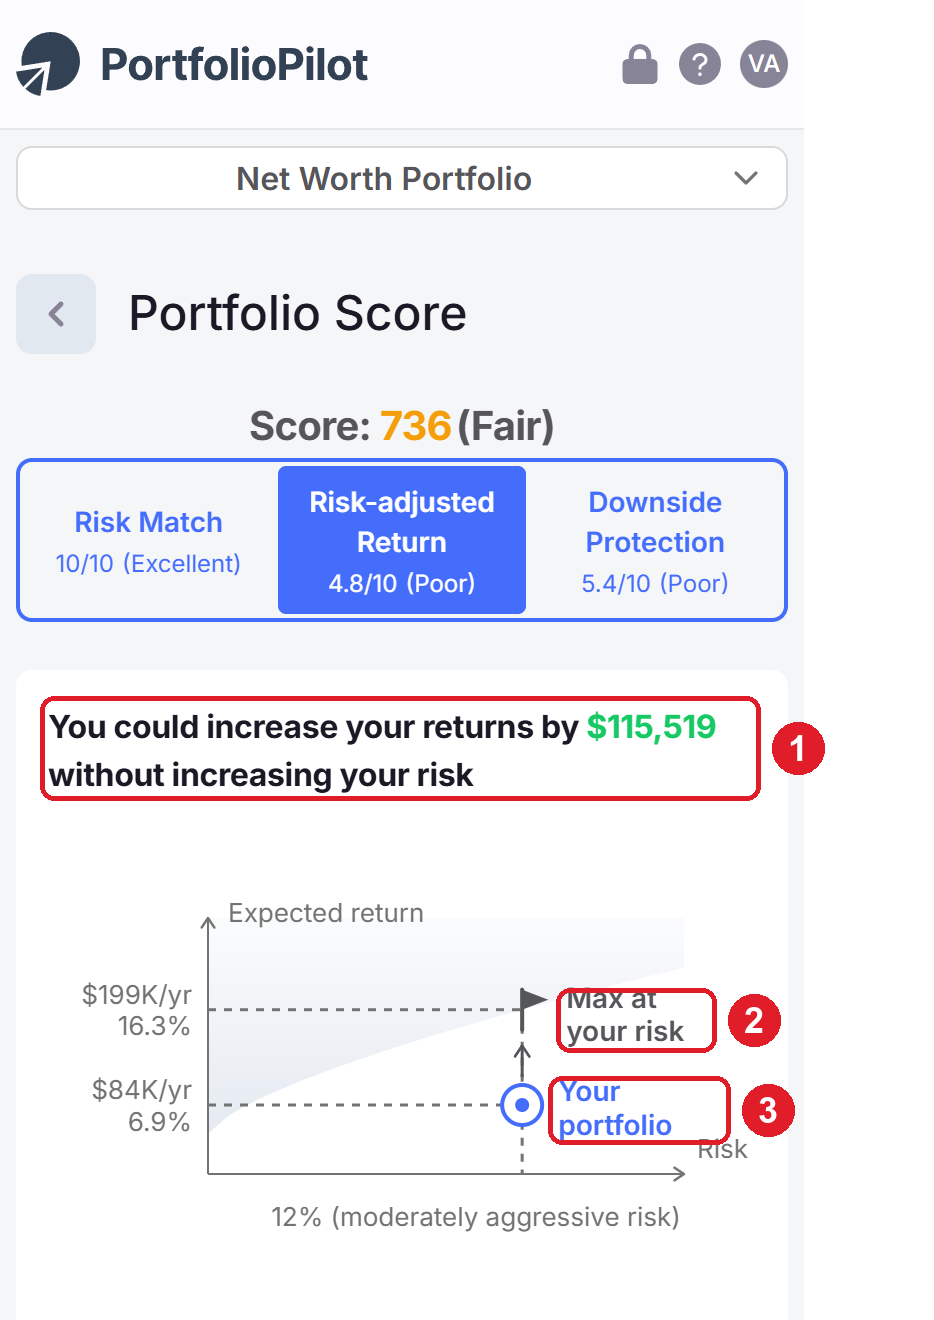
Mobile view: the efficiency headline and the efficient-frontier diagram. Figures shown are illustrative.
Downside Protection: how well are you shielded from shocks?
Downside Protection measures how well your portfolio would hold up under extreme stress: a recession, a spike in inflation, a sudden interest-rate move. A higher score means you are better cushioned when markets turn.
Open the Downside Protection tab. At the top, a headline tells you how many areas you are protected in: in the example, 3 of 10 (1). Below it, ten risk areas together make up this score (2). One important detail: the weight of this component is scaled to your risk preference, but even aggressive investors benefit from some downside protection.
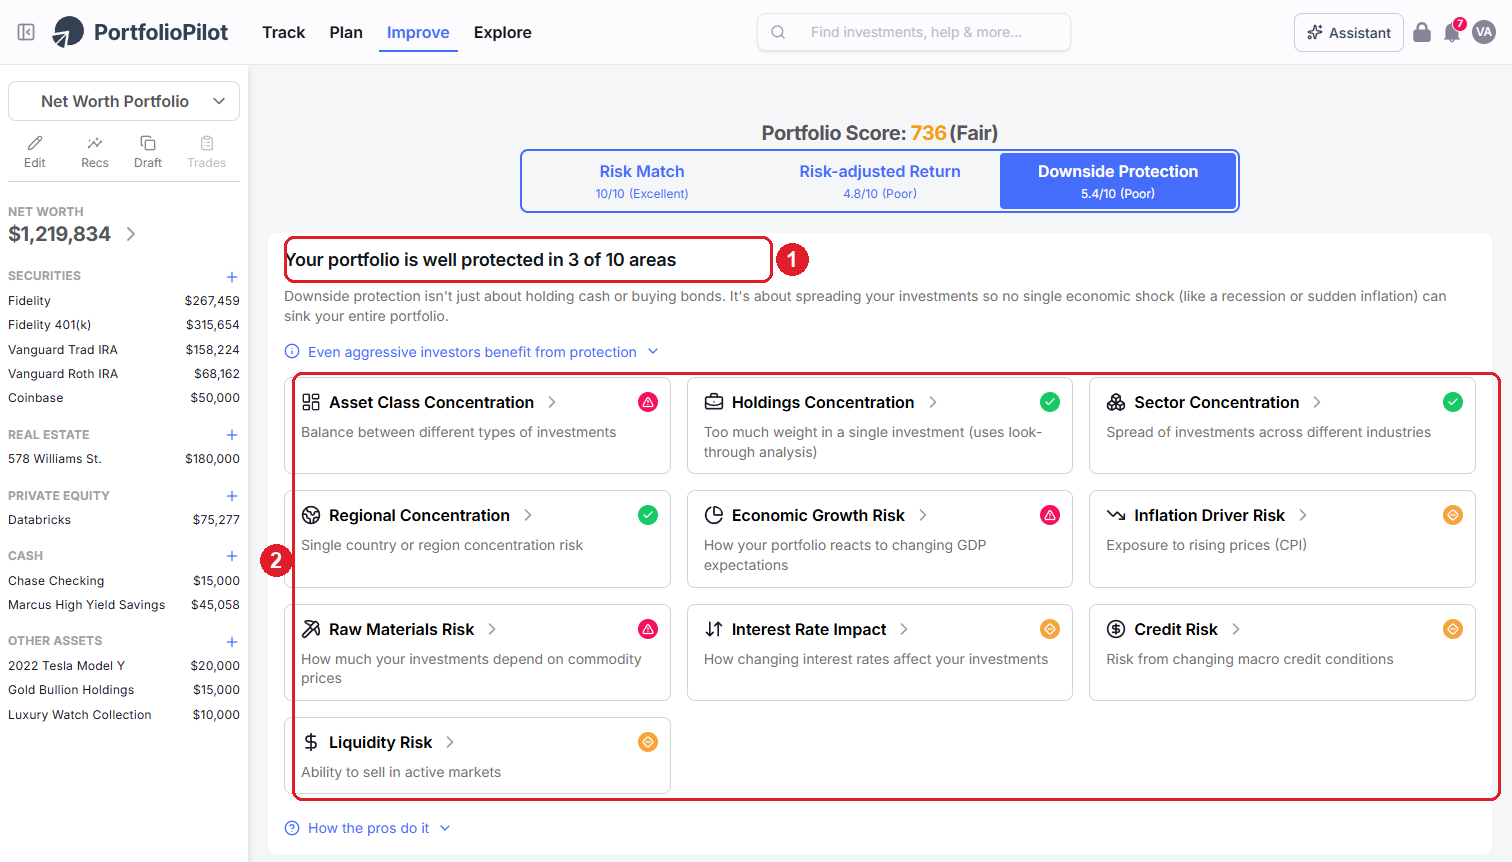
The ten areas (2) each tell you whether you are over-exposed to one kind of shock. A red triangle needs attention, an orange diamond is moderate, a green check means you are well-protected. Figures shown are illustrative.
Each area carries an icon: a red triangle flags a high-risk area that needs attention, an orange diamond suggests moderate risk, and a green check means you are well-protected there. Each score is based on both how that exposure behaved in past crises and how it is simulated to behave in future scenarios. Here is what the ten areas mean:
- Holdings Concentration: too much weight in a single investment (it uses look-through analysis to see inside funds). Spread across more positions.
- Asset Class Concentration: the balance between different types of investment. Mix equities, fixed income, real estate, and commodities.
- Sector Concentration: the spread of investments across industries. Balance technology, finance, healthcare, and others rather than crowding into one.
- Regional Concentration: single-country or single-region risk. Add exposure outside your home market.
- Economic Growth Risk: how your portfolio reacts to changing GDP expectations. Balance growth-sensitive holdings with more defensive ones.
- Inflation Driver Risk: exposure to rising prices (CPI). Assets like TIPS or commodities can hedge it.
- Interest Rate Impact: how changing rates affect your investments, especially bonds. Diversify across maturities and asset types.
- Credit Risk: risk from changing macro credit conditions. Some investment-grade exposure steadies this.
- Liquidity Risk: your ability to sell in active markets. Keep a portion in highly liquid holdings.
- Raw Materials Risk: how much your investments depend on commodity prices. Avoid over-tilting toward commodity-linked names.
How to improve it. Reduce the concentrations the grid flags and diversify across assets, sectors, and regions, then revisit as conditions change. PortfolioPilot's Downside Protection recommendations (a premium feature) will suggest specific diversifying additions for the areas where you are most exposed.
On a phone, the protected-areas headline (1) sits above the same ten areas, which stack into a single scrollable column (2).
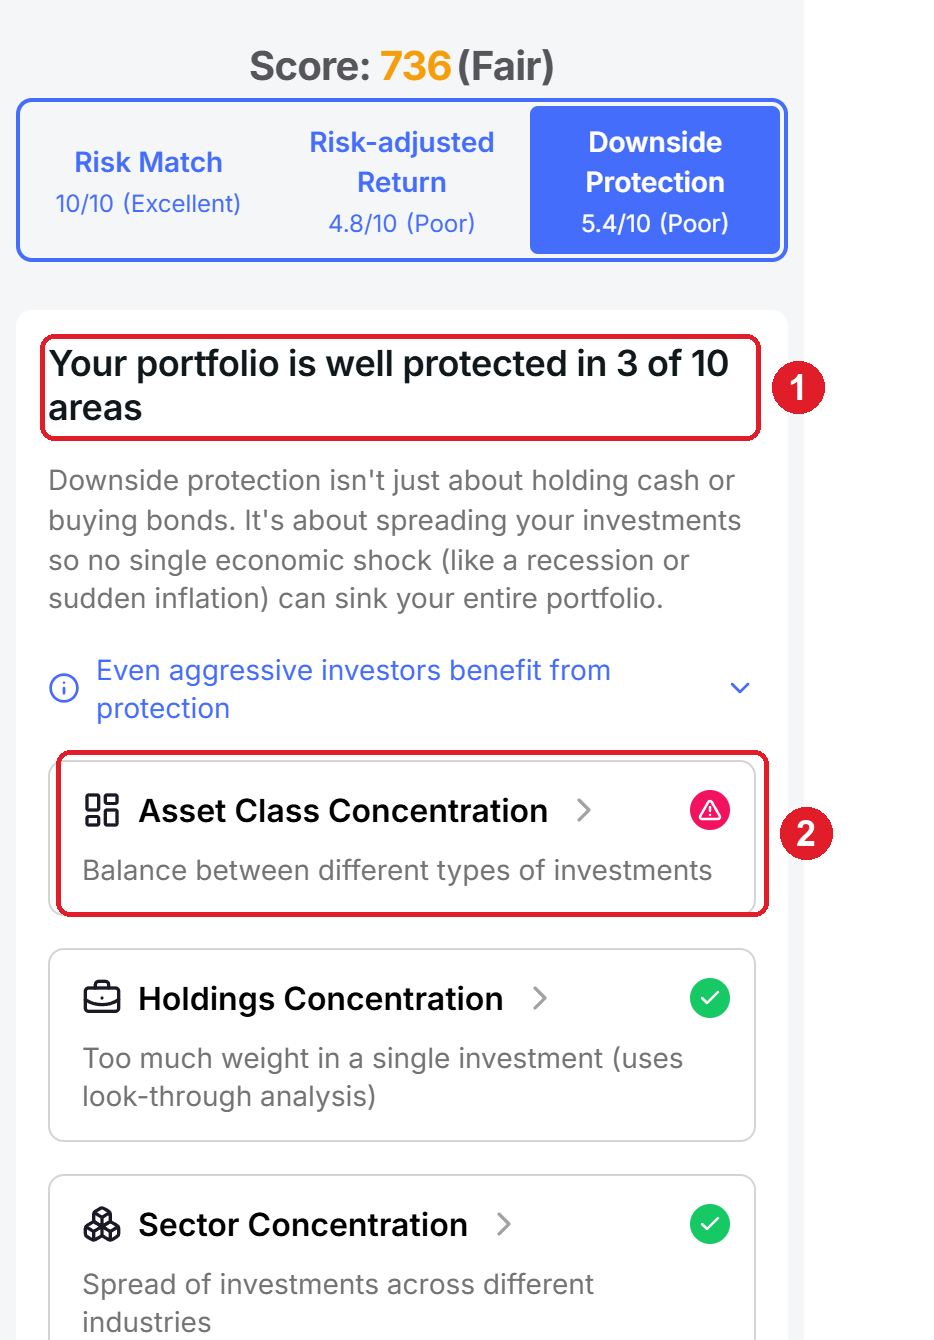
Mobile view: the protected-areas headline and the ten risk areas. Figures shown are illustrative.
Compare your score to a benchmark
To put your score in context, open Improve, then Analyze & compare. Pick the two things you want to compare at the top right: your portfolio and an index such as the S&P 500, or two of your own portfolios (1). The table then lines up your Portfolio Score and all three components (2) directly above the underlying numbers that drive them: expected return, risk, dividend yield, and fund fees (3).
This is where the trade-offs become obvious: in the example, the portfolio takes less risk than the index (12.3% vs 15.2%) and pays a higher dividend yield (2.55% vs 1.01%), while giving up a little expected return (6.9% vs 7.1%).
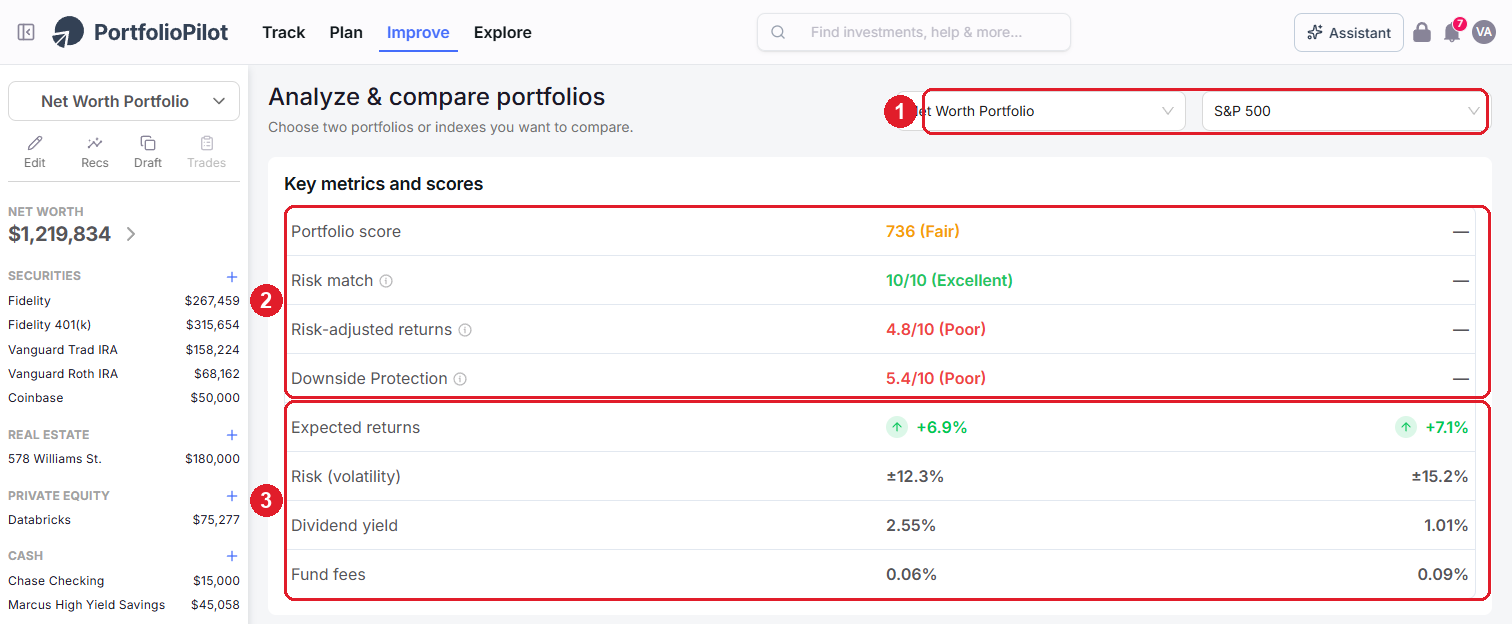
Comparing against a benchmark (1) shows how your score (2) is explained by the numbers underneath it (3). Figures shown are illustrative.
On a phone, the two selectors (1) sit at the top, with the scores (2) and the underlying metrics (3) stacked below.
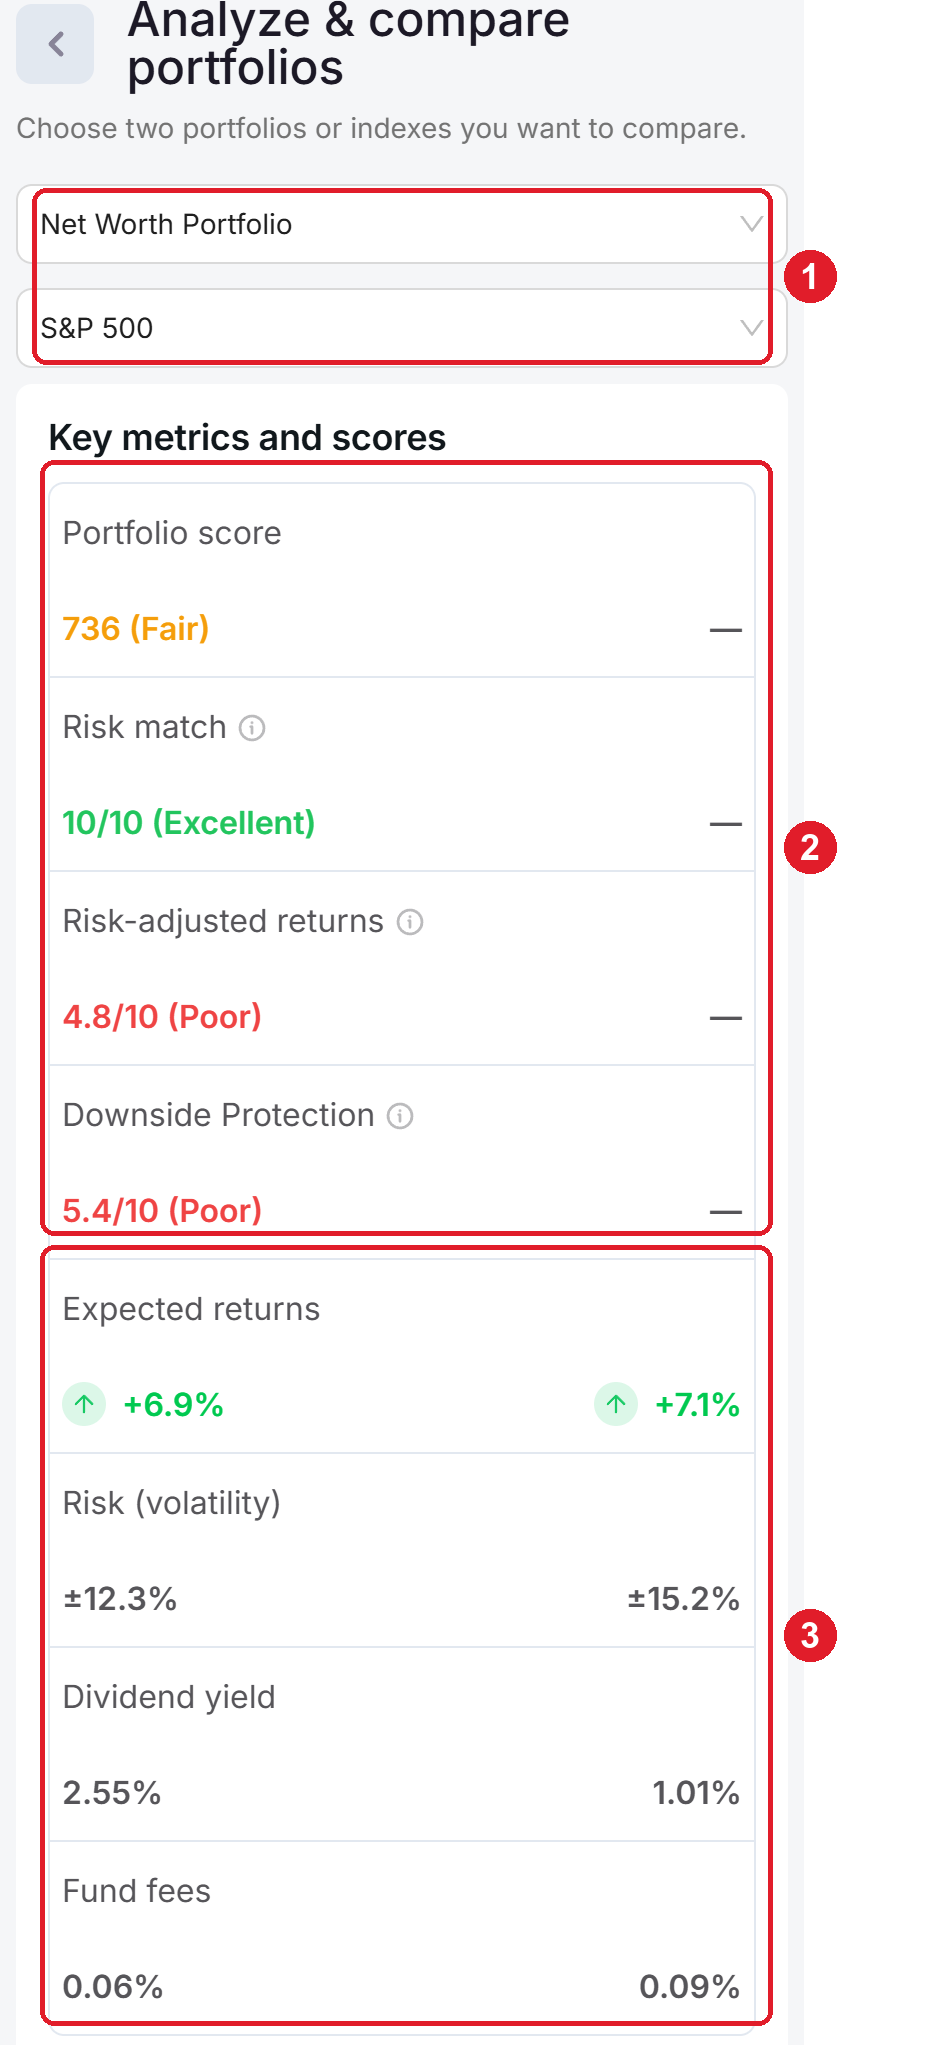
Mobile view: your score and metrics against an index. Figures shown are illustrative.
Why your Portfolio Score changes
The score is recalculated across your whole net worth whenever the inputs change, so it is normal for it to move. The usual reasons:
- Markets moved: as prices change, so do your portfolio's risk, expected returns, and exposures. The score can shift on a day you do not trade at all. This is expected.
- You added or connected an account: because the score covers your entire net worth, adding holdings re-mixes the whole portfolio and recalculates every component. A new account that is concentrated in a few names or one sector can pull Downside Protection or Risk Match down even if each holding is fine on its own; a well-diversified addition can lift the score. If a newly connected account moved your score in a surprising way, first confirm its holdings and cash imported correctly. See Import Your Net Worth.
- You changed your preferences: updating your risk preference re-grades Risk Match against the new target, and changing your objective or assumptions can move the other components.
- You split accounts into Asset Groups: scoring a tax-advantaged account and a taxable account against different preferences, instead of one blended preference, changes how each is graded. See Asset Groups.
How to improve your Portfolio Score
The single fastest way to raise your score is to open Personalized Recommendations: every recommendation is generated specifically to improve your Portfolio Score, and it shows the projected before-and-after for each component before you act. Beyond that, these are the moves that help most often:
- Bring your risk in line with your preference (the Risk Match lever above).
- Add uncorrelated assets to earn more for the same risk (Risk-adjusted Return).
- Diversify across holdings, asset classes, sectors, and regions to reduce the flagged downside risks.
- Separate taxable and tax-advantaged money into Asset Groups so each is scored against the right preference.
- Stage any change in a Draft Portfolio and watch the score update before you commit.
The sections that follow, How the Portfolio Score works, Common use cases, and Next steps, are background reading rather than things to set up.
How the Portfolio Score works
- One integrated score: the three components are deliberately combined, because real portfolios are interconnected. The goal is to see your holdings as one set rather than disconnected pieces. A high score in one component cannot fully offset a low score in another.
- Risk Match: compares your portfolio's expected volatility to the volatility implied by your chosen risk preference; the smaller the gap, the higher the score.
- Risk-adjusted Return: the Sharpe Ratio: overall expected return (the weighted sum across your holdings) divided by overall portfolio volatility (a non-linear combination of the individual volatilities, because diversification means the whole is not the sum of the parts).
- Downside Protection: scores ten exposures using both historical behavior in past crises and simulated behavior in future stress scenarios; its weight in the overall score is scaled to your risk preference.
Common use cases
"My Risk-adjusted Return says Poor. Is my portfolio bad?"
No. Poor means you could earn more for the same risk: your portfolio sits below the efficient frontier. Open the Risk-adjusted Return tab to see the gap, then use Personalized Recommendations to add uncorrelated assets and confirm the score rises in a draft.
"My score dropped right after I connected a new account."
The score covers your whole net worth, so a new account recalculates everything. If it is concentrated, say most of it in two stocks, your Holdings and Sector Concentration rise and pull Downside Protection down. Diversify that account, or group it separately, and first confirm it imported correctly.
"Risk Match is my best component but my overall score is still only 'Fair.'"
The overall score combines all three. A perfect Risk Match cannot offset a Poor Risk-adjusted Return and a Poor Downside Protection, so the work to do is on those two: improve efficiency and diversify, not risk.
Next steps
- Tutorial: Personalized Recommendations. Turn your score into specific, prioritized actions.
- Tutorial: Asset Groups. Place assets in the right accounts so each is scored correctly.
- Tutorial: Draft Portfolio. Test changes safely and watch the score respond before you trade.
- Tutorial: Import Your Net Worth. Get every account in so the score reflects your whole picture.
- Tutorial: Tax Optimization. Improve after-tax outcomes alongside your score.
Note: Specific investments described herein do not represent all investment decisions made by Global Predictions. The reader should not assume that investment decisions identified and discussed were or will be profitable. Specific investment advice references provided herein are for illustrative purposes only and are not necessarily representative of investments that will be made in the future. The Portfolio Score is a hypothetical measurement and does not guarantee avoiding losses.
Global Predictions provides investment advice only through its internet-based application, PortfolioPilot, and only to individuals who are advisory clients of Global Predictions pursuant to written advisory Client Agreements ("Advisory Services"). The publicly available portions of the Platform (i.e., the sections of the Platform that are available to individuals who are not party to a Client Agreement, including globalpredictions.com and portions of portfoliopilot.com) are provided for educational purposes only and are not intended to provide legal, tax, or financial planning advice. To the extent that any of the content published on publicly available portions of the Platform may be deemed to be investment advice, such information is impersonal and not tailored to the investment needs of any specific person. Nothing on the publicly available portions of the Platform should be construed as a solicitation or offer, or recommendation, to buy or sell any security. All charts, figures, and graphs on the publicly available websites are for illustrative purposes only. Before investing, you should consider whether any investment, investment strategy, security, other asset, or related transaction is appropriate for you based on your personal investment objectives, financial circumstances, and risk tolerance. You are also encouraged to consult your legal, tax, or investment professional regarding your specific situation. Registration does not imply a certain level of skill or training. Investing involves risk. The value of your investment will fluctuate, and you may gain or lose money.
Case studies and examples presented are hypothetical scenarios intended for illustrative purposes only. They do not represent an actual client, investment, or experience, but rather are meant to provide an example of the intended process and methodology. An individual's experience may vary based on his or her circumstances. There can be no assurance that the Firm will achieve similar results in comparable situations. No portion is to be interpreted as a testimonial or endorsement of the Firm's investment advisory services.
The contents of the Platform may contain forward-looking statements based on management's beliefs, assumptions, current expectations, estimates, and projections. Forward-looking statements are not guarantees of future performance, and actual results may differ materially from those expressed or forecasted. Note: our use of the term AI refers to all artificial intelligence models used, including large language models, proprietary economic models that incorporate regression or dynamic factors, and machine learning methods like supervised learning. For more information, see our disclosures at globalpredictions.com/disclosures.
The Portfolio Score and its full component breakdown are part of the free plan. Acting on the score with Personalized Recommendations and Downside Protection recommendations is available with Gold, Platinum, or Pro (all with a 10-day free trial, no credit card required).
