Monte Carlo Retirement Models: What They Miss


Monte Carlo simulations are widely used in retirement planning, but they often overlook key real-world risks. They run thousands of scenarios to estimate the likelihood that your money will last. Sounds great, right? But here’s the problem, real life doesn’t follow a neat statistical pattern.
Markets crash, inflation spikes, and unexpected expenses arise. Studies show that retirees frequently adjust their spending due to changing financial conditions—yet many Monte Carlo models assume fixed withdrawals and steady returns, ignoring how people actually manage their finances in retirement.
So, what’s missing? And more importantly, how can you make your retirement plan more resilient? Let’s break it down in simple, real-world terms.
Key Takeaways
- Monte Carlo simulations assume average returns, but sequence risk can throw off your entire plan.
- Fixed spending models don’t reflect how retirees actually adjust their expenses.
- A flexible withdrawal strategy can make your money last longer.
- Testing your plan against real-world risks makes all the difference.
Simulation results are hypothetical and depend on assumptions that may not reflect actual market conditions, inflation paths, or individual behavior.
1. The Hidden Flaw: Sequence of Returns Risk
Many people assume that if they average a 7% return, they’re in good shape. But here’s what Monte Carlo models don’t always highlight: the order of those returns matters more than the average itself.
Why This Matters
Imagine two people, Alex and Jamie, both retiring with $1 million. They both average the same 7% return over 30 years. But Alex starts retirement in a bull market, while Jamie hits a recession in the first five years. Even though they average the same return, Jamie’s portfolio gets depleted much faster.
The Problem
When you withdraw money from a shrinking portfolio (during a downturn), you lock in those losses, making it much harder to recover.
Solution
Instead of assuming everything will be fine, you could use a dynamic withdrawal strategy, adjusting your spending based on market conditions can help prevent disaster.
2. Fixed Spending Assumptions Don’t Match Real Life
Most Monte Carlo models assume retirees withdraw a set amount every year, adjusted for inflation. But does that match how people actually spend money in retirement? Not really.
Real Retirement Spending Trends
- Go-Go Years (60s-70s): More travel, hobbies, and discretionary spending.
- Slow-Go Years (70s-80s): Less travel, fewer big-ticket expenses.
- No-Go Years (80s-90s+): Rising healthcare and long-term care costs.
If you follow a rigid withdrawal plan, you might take out too much too early or underestimate future expenses. A better approach? Plan for flexible spending that adjusts with your needs.
Turn your retirement assumptions into concrete, model-driven scenarios.
3. The Problem with Averages: Market Volatility is Real
Monte Carlo models rely on historical market averages, but averages can be deceiving.
What This Means for You
- A 7% average return can include some years with -20% losses.
- Inflation doesn’t stay steady—it spikes unexpectedly.
- Black swan events (think 2008 or 2020) can destroy projections.
Solution
Instead of relying on a single model, stress-test your portfolio with worst-case market scenarios. Ask yourself: What happens if I retire into a bear market? What if inflation jumps to 6% instead of 2%? The more prepared you are, the better.
4. How to Make Your Retirement Plan More Realistic
Monte Carlo simulations can still be useful, but they need some tweaking. Here’s how to make them work for you:
- Account for sequence risk: Run simulations where the first 5 years of retirement are a bear market.
- Use flexible withdrawal strategies: Adjust spending as needed, rather than sticking to a fixed percentage.
A key weakness of traditional Monte Carlo models is their reliance on simplified assumptions, often treating returns as static and withdrawals as fixed. However, real-world retirement outcomes vary based on market conditions, economic cycles, and investor behavior.
The graph below illustrates the calibration of various Monte Carlo models.
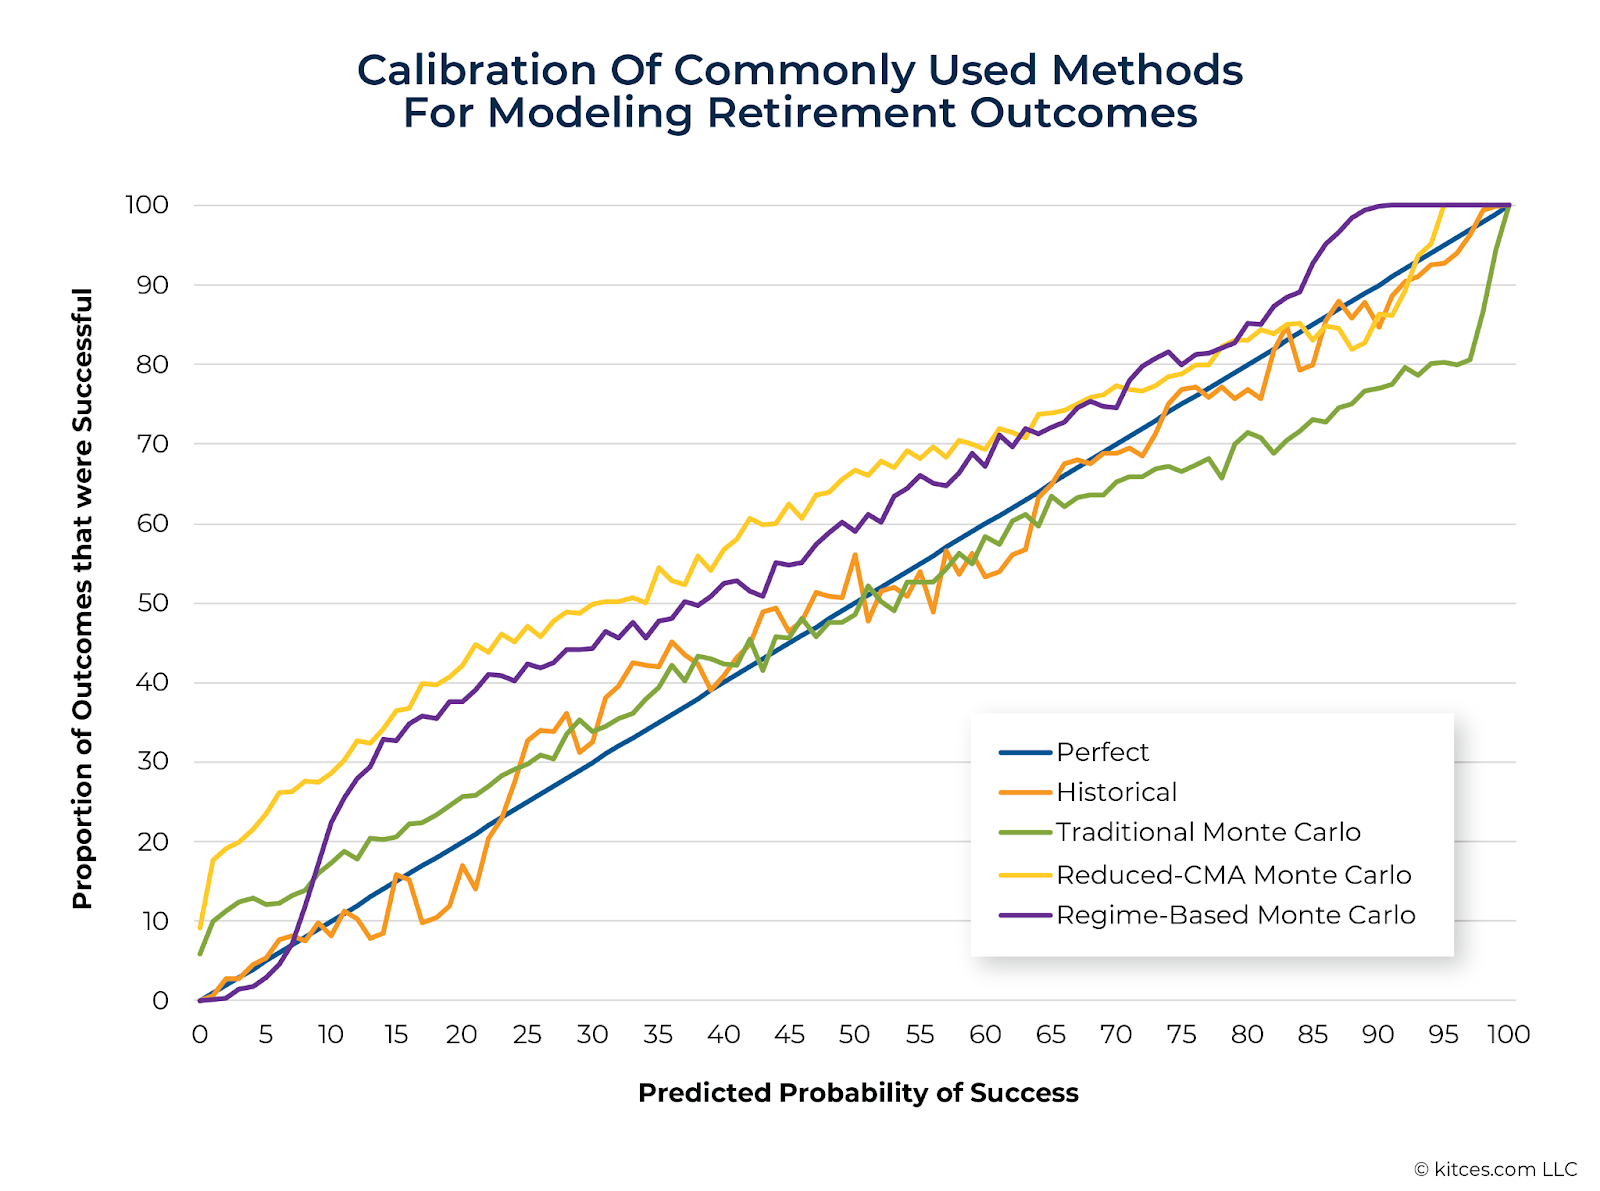
The chart from the study "How Different Monte Carlo Models Perform In The Real World: Assessing Quality Of Predictiveness In Retirement Income Forecasting Models" by Kitces.com compares the accuracy of various Monte Carlo methodologies in predicting retirement success. The closer a model’s results align with the “Perfect” calibration line (blue), the more accurately it predicts real-world outcomes. Traditional and Reduced-CMA Monte Carlo models (green and orange) show greater forecasting errors, while Historical and Regime-Based Monte Carlo models (yellow and purple) provide more reliable predictions. Notably, Regime-Based Monte Carlo models tend to underestimate success probabilities, meaning retirees following these projections are more likely to end up with excess savings rather than depleting their funds too soon.
A Smarter Approach to Retirement Planning
Monte Carlo simulations are a great tool, but they’re not perfect. They often assume smooth markets, predictable spending, and a world without surprises. Real life doesn’t work that way.
The good news? You can take control of your retirement by making simple adjustments. Think beyond averages, expect the unexpected, and be flexible with your withdrawals. That way, you’re not just hoping your money lasts, you’re making sure it does.
How optimized is your portfolio?
PortfolioPilot is used by over 50,000 individuals in the US & Canada to analyze their portfolios of over $40 billion1. Discover your portfolio score now:

An easy way to plan your financial future
PortfolioPilot helps you plan and achieve your retirement goals, with financial models that predict your retirement success and calculate the taxes involved.

.webp)