AI Financial Advisor ROI Across Portfolio Sizes

According to ICI’s latest fee study, the asset-weighted average expense ratio for equity mutual funds was 0.40% in 2024, down markedly from prior decades; fees remain one of the few variables investors directly control. A person might think “ROI from an advisor equals higher returns”, but the more practical lens is total, after-fee, after-tax outcomes - plus fewer costly mistakes. This article explains how the return on investment (ROI) of an AI financial advisor can scale differently for small, mid-sized, and larger portfolios, and what to look for when weighing costs against measurable benefits.
Key Takeaways
- ROI isn’t just performance—fees, taxes, and behavior often drive more of the spread than investors expect.
- AUM-based pricing scales with portfolio size; flat subscriptions scale with usage. Either can be reasonable depending on needs.
- Tangible levers include tax-aware actions (e.g, lot-level loss harvesting), fee audits, cash-drag controls, and diversification checks - none guarantee outcomes.
- The same feature can have different payoffs by portfolio size; small accounts may feel costs more acutely, while larger accounts may benefit more from tax and fee precision.
- Good tools show assumptions and give audit trails so investors can evaluate whether the value outweighs the cost.
What “ROI” really means for advice
ROI from financial tooling is the net value after: (a) advisory/platform fees, (b) fund/transaction costs, (c) estimated taxes, and (d) behavior-driven slippage (buying high, selling low, sitting in cash too long). Morningstar’s US Fund Fee studies indicate that lower expense ratios are a reliable predictor of better subsequent net results, while ICI documents the broad decline in fees over time (ICI, 2025; Morningstar, 2023). So what? If an advisor’s pricing and features don’t move one of these levers, measurable ROI may be limited.
In practice, an AI financial advisor can contribute by reducing avoidable friction and systematizing repeatable choices: identifying high-fee holdings, flagging cash drag, estimating tax character before trades, and documenting the “why” behind actions. None of this predicts markets; it organizes decisions.
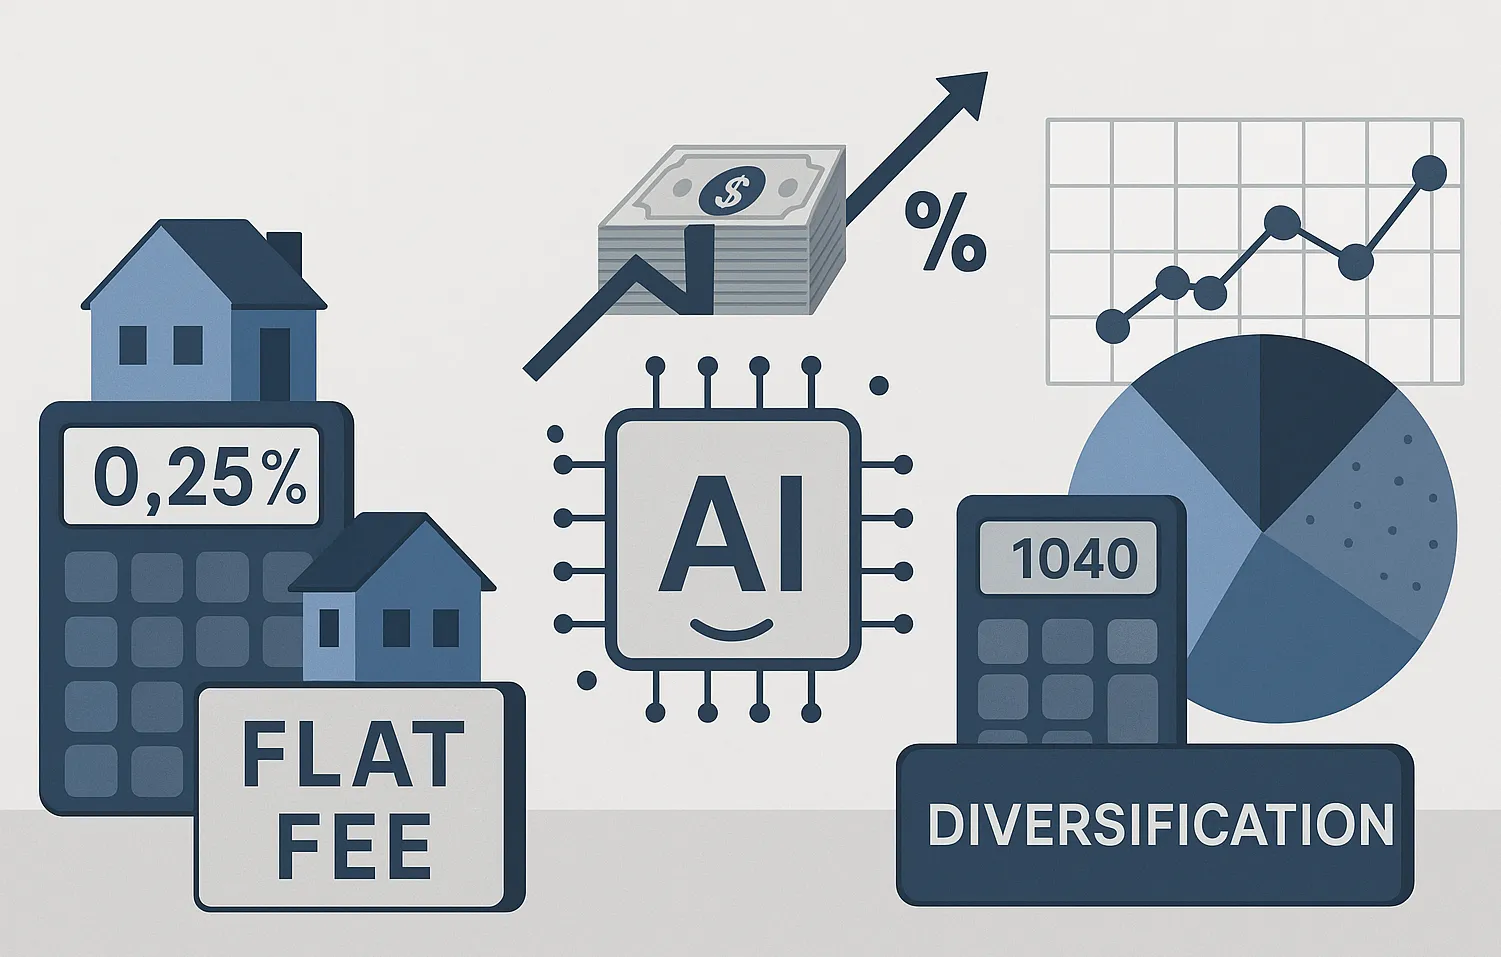
Pricing models: why portfolio size matters
Advisory pricing generally falls into two buckets:
The same pricing structure can feel efficient or inefficient depending on portfolio size and the types of decisions being supported.
- Percentage of assets (AUM): Scales with portfolio size (e.g. 0.25% 1.00%+). Easy to understand, but dollar cost rises quickly as wealth grows.
- Flat subscription: A fixed monthly/annual fee for analytics and recommendations. Scales with usage complexity rather than asset size.
Hypothetical (illustrative only):
- $25,000 portfolio at 0.25% AUM ≈ $62.50/yr. A $30/mo flat tool ≈ $360/yr. For very small accounts, lower AUM fees may feel lighter.
- $250,000 at 0.25% AUM ≈ $625/yr vs. $360/yr flat. Now the flat fee often costs less.
- $1,000,000 at 0.25% AUM ≈ $2,500/yr vs. $360/yr flat. For larger balances, a flat fee can be materially cheaper.
This math ignores portfolio complexity and optional add-ons, but it shows why size changes the break-even. Investors often compare the fee model against expected savings from tax awareness, fund selection, and fewer errors.
Where AI features can create measurable value (across sizes)
1) Tax-aware actions (with documentation).
Lot-level loss harvesting, holding-period awareness (short- vs. long-term), and account-location reminders can change after-tax results - especially in taxable accounts. Good tools show assumptions (brackets, state rate, NIIT) and constraints (wash-sale alerts). None of these tactics guarantees benefits every year, but they add discipline that’s hard to replicate ad hoc (IRS, Pub. 550; Topic No. 409).
2) Fee and drag audits.
- Identify high-expense funds and suggest lower-cost alternatives in concept (without recommending specific tickers).
- Flag advisory/platform fees and overlapping funds.
- Watch for cash drag - uninvested cash earning less than market alternatives.
So what? Even small percentage changes compounded over years can outweigh tool costs, particularly for mid-to-large portfolios.
3) Diversification and risk views.
Correlation shifts (e.g., 2022) showed that the “stock-bond” split can behave differently under stress. An AI that quantifies concentration and scenario exposure helps investors understand why volatility is happening and consider neutral, rules-based adjustments - without market timing.
4) Behavioral guardrails.
DALBAR’s QAIB consistently shows that many investors sell into drawdowns and miss market recoveries - 2024 withdrawals peaked just ahead of major rebounds. Timely nudges (e.g., "you're realizing short-term gains two weeks before long-term eligibility") can reduce regret without predicting the market.
Get recommendations across fees, taxes, risk, returns, and downside factors.
How ROI differs by portfolio size
Smaller portfolios (e.g., <$50k).
- Sensitivity: Platform fees loom larger as a % of assets.
- High-impact basics: Avoiding high-expense funds, limiting short-term gains, and reducing cash drag may yield the clearest benefits.
- Practical heuristic: If a tool prevents a single short-term taxable gain realization or replaces one high-expense fund, that alone may offset a sizable portion of its annual cost.
Mid-sized portfolios (e.g., $50k–$500k).
- Inflection point: The fee break-even often tilts toward flat subscriptions.
- Added levers: Tax-lot selection and account location start to matter more; documentation helps coordinate with a tax professional.
So what? Small, repeatable wins (fees, taxes, cash) can stack up year after year.
Larger portfolios (e.g., $500k+).
- Dollar stakes: AUM fees compound into thousands per year; even modest frictions scale.
- Complexity: Multiple accounts, vesting events, and charitable gifting opportunities mean explainability is crucial (what assumptions were used, what trade-offs were considered).
- Risk control: Concentration and sequence-of-returns risk become more salient for retirement timelines.
What to look for before deciding the cost is “worth it”
A mature AI financial advisor typically provides:
- Assumptions panel: Filing status, brackets, state rate, NIIT; editable and saved with each analysis.
- Lot-level transparency: Realized/unrealized gains by character and potential wash-sale flags.
- Fee finder: Expense ratio comparisons and advisory/platform fee visibility, expressed in dollars and percent.
- Cash policy & alerts: Target ranges and prompts when idle cash exceeds thresholds investors set.
- Scenario views: Neutral “what-if” cases (e.g. inflationary spike, rate cuts) without performance promises.
- Audit trail: Downloadable rationale for decisions to support consistency over time.
If these elements are missing - or if the system can’t explain the drivers behind a suggestion - the ROI case may be weaker.
The most durable ROI often comes from removing frictions consistently, not chasing one-off wins. Clear pricing, explainable analytics, and a record of decisions help investors stay disciplined - across all portfolio sizes.
The following article is provided for educational purposes only and does not constitute personalized investment, tax, or legal advice. Any examples are hypothetical and for illustrative purposes only. Investing involves risk, and outcomes may differ materially from any projections or scenarios discussed. Readers should consult with a qualified financial, tax, or legal professional regarding their individual circumstances
How optimized is your portfolio?
PortfolioPilot is used by over 50,000 individuals in the US & Canada to analyze their portfolios of over $40 billion1. Discover your portfolio score now: