
Tutorial: Crisis Simulation
The Simulations page answers one practical question: how would your portfolio hold up in a crisis? It replays the worst moments in market history on a portfolio like yours, lets you imagine any future you can describe in plain English, and shows roughly how much you could lose and how long it could take to recover, so you can set a risk level you can live with before a downturn arrives, not during one.
What you'll find in this tutorial
You do not have to follow these in order. Click any section to jump straight to it, or open the Simulations page in the app to follow along.
- Find the Simulations page
- Read a historical crisis result
- Switch between the Drawdown and Cumulative views
- Imagine any future: the Future tab
- Connect a shock to your retirement plan
Learn more: How the simulation works, Common use cases, and Next steps.
Throughout, the red markings on each screenshot point to exactly what the text is describing: a (1) in the text matches the 1 badge on the image. Where the phone layout differs, a mobile screenshot follows the desktop one.
Find the Simulations page
From the top navigation bar, open Improve and choose Simulations. At the top of the page you will see three tabs (1):
- Global Crisis 2008 and COVID Crash 2020: two historical crises that are pre-modeled for you.
- Future: describe any future you can imagine and have it simulated against your portfolio. The page opens on this tab by default. Everything here is free on every plan.
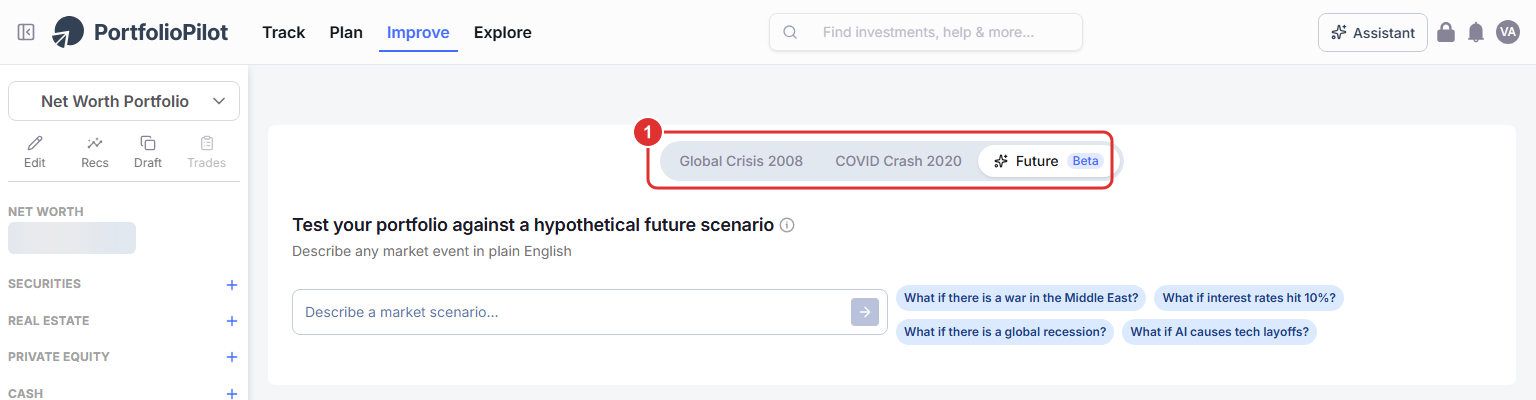
Open Improve > Simulations. The two historical-crisis tabs are on the left; the Future tab is on the right and opens by default.
On a phone, open Improve from the bottom navigation bar and tap Simulations. The same three tabs sit at the top of the page, with the scenario box and prompts below them.
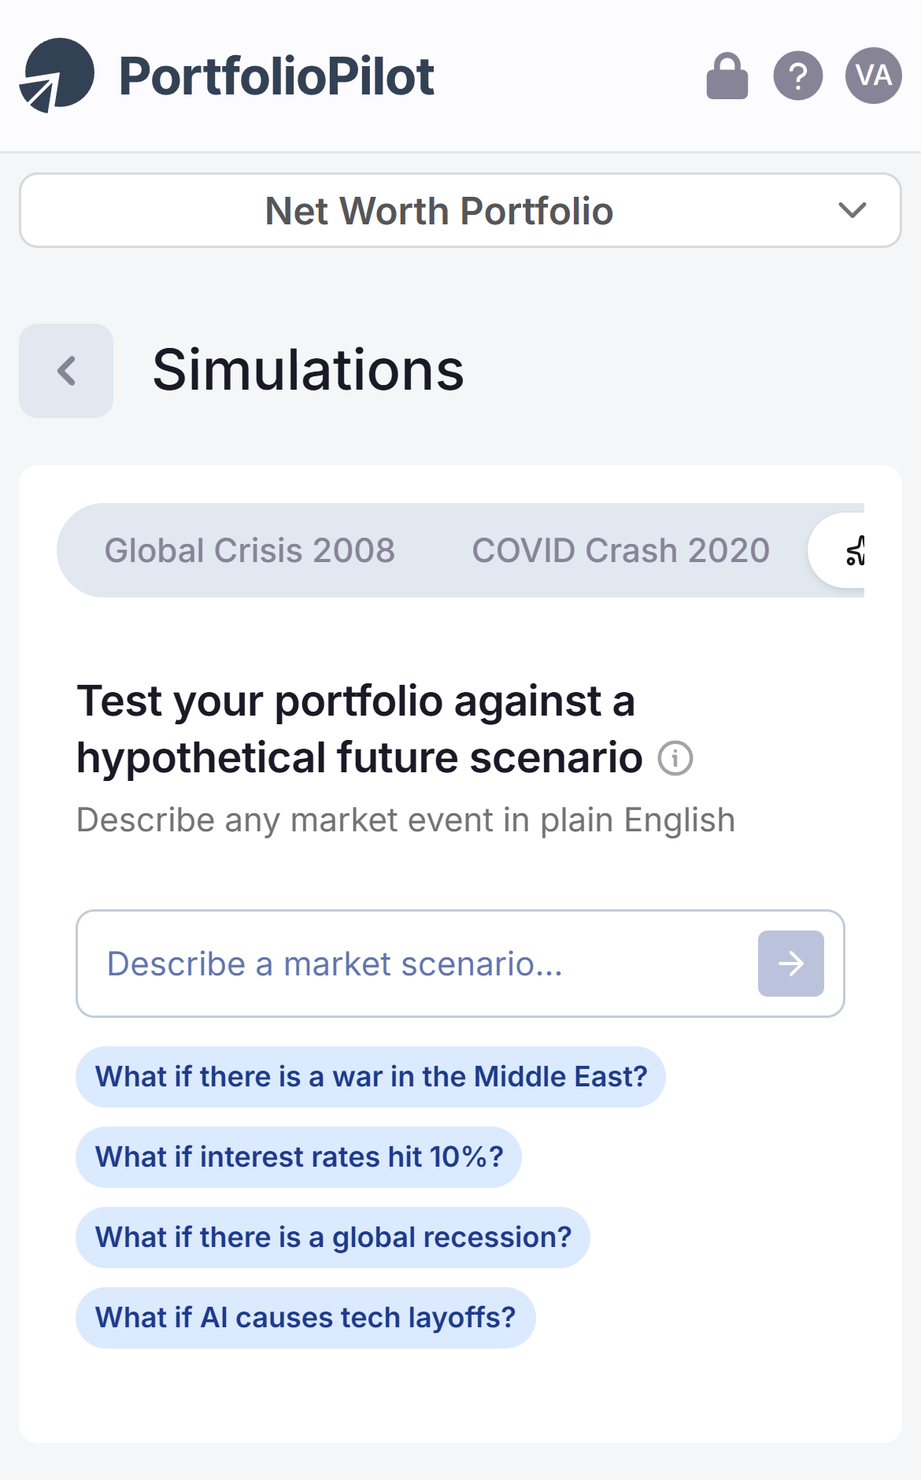
Mobile view: open Improve, then Simulations. The three tabs sit at the top, with the Future scenario box and example prompts below.
Read a historical crisis result
Open one of the two historical tabs: for example Global Crisis 2008. PortfolioPilot replays that crisis on a portfolio like yours and reports two things (1):
- Total portfolio loss: the deepest drop (the maximum drawdown) during the crisis, in dollars and as a percentage.
- Recovery time: how long the drawdown lasted, from the value peak down to the point where it had fully recovered.
Next to it (2), a benchmark comparison shows how the S&P 500 and Global 60/40 (a traditional 60% equities, 40% bonds portfolio) fared over the same window, so you can see whether a portfolio like yours was more or less resilient than the market. The chart below plots the whole episode. (Why a portfolio "like yours" rather than your exact holdings? See How the simulation works.)
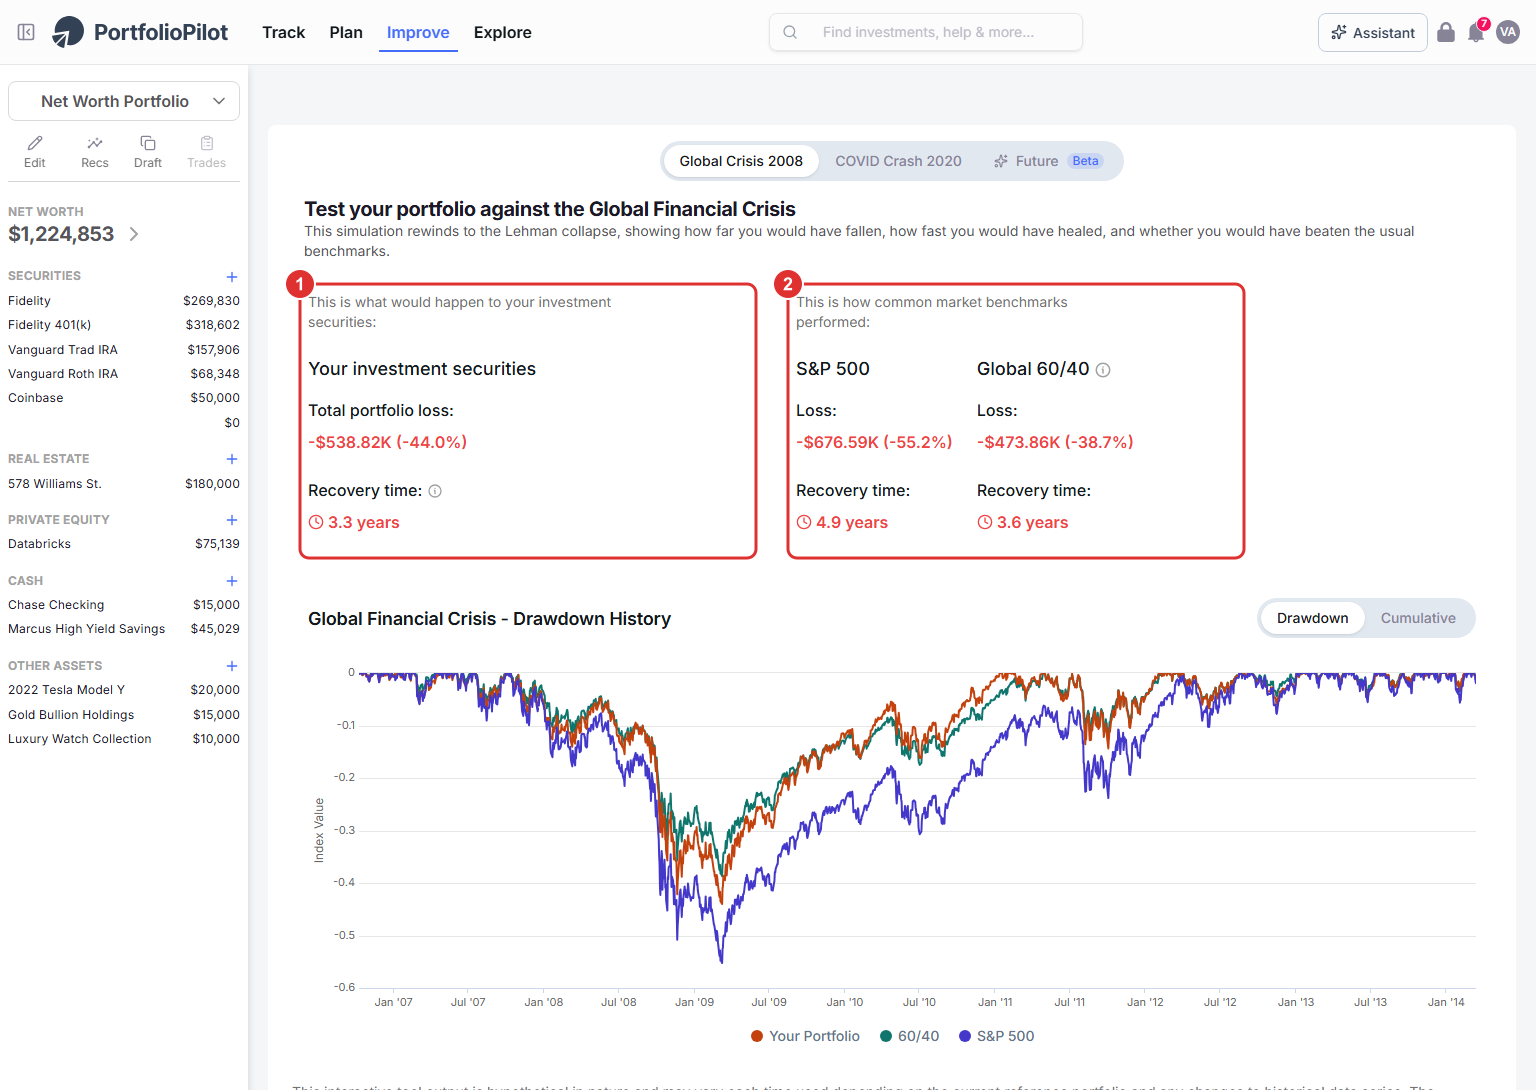
Each historical tab shows your maximum loss and recovery time next to the S&P 500 and a Global 60/40 portfolio. Figures shown are illustrative.
On a phone, the same result stacks vertically: your Total portfolio loss and Recovery time first (1), with the benchmarks and the chart below as you scroll.
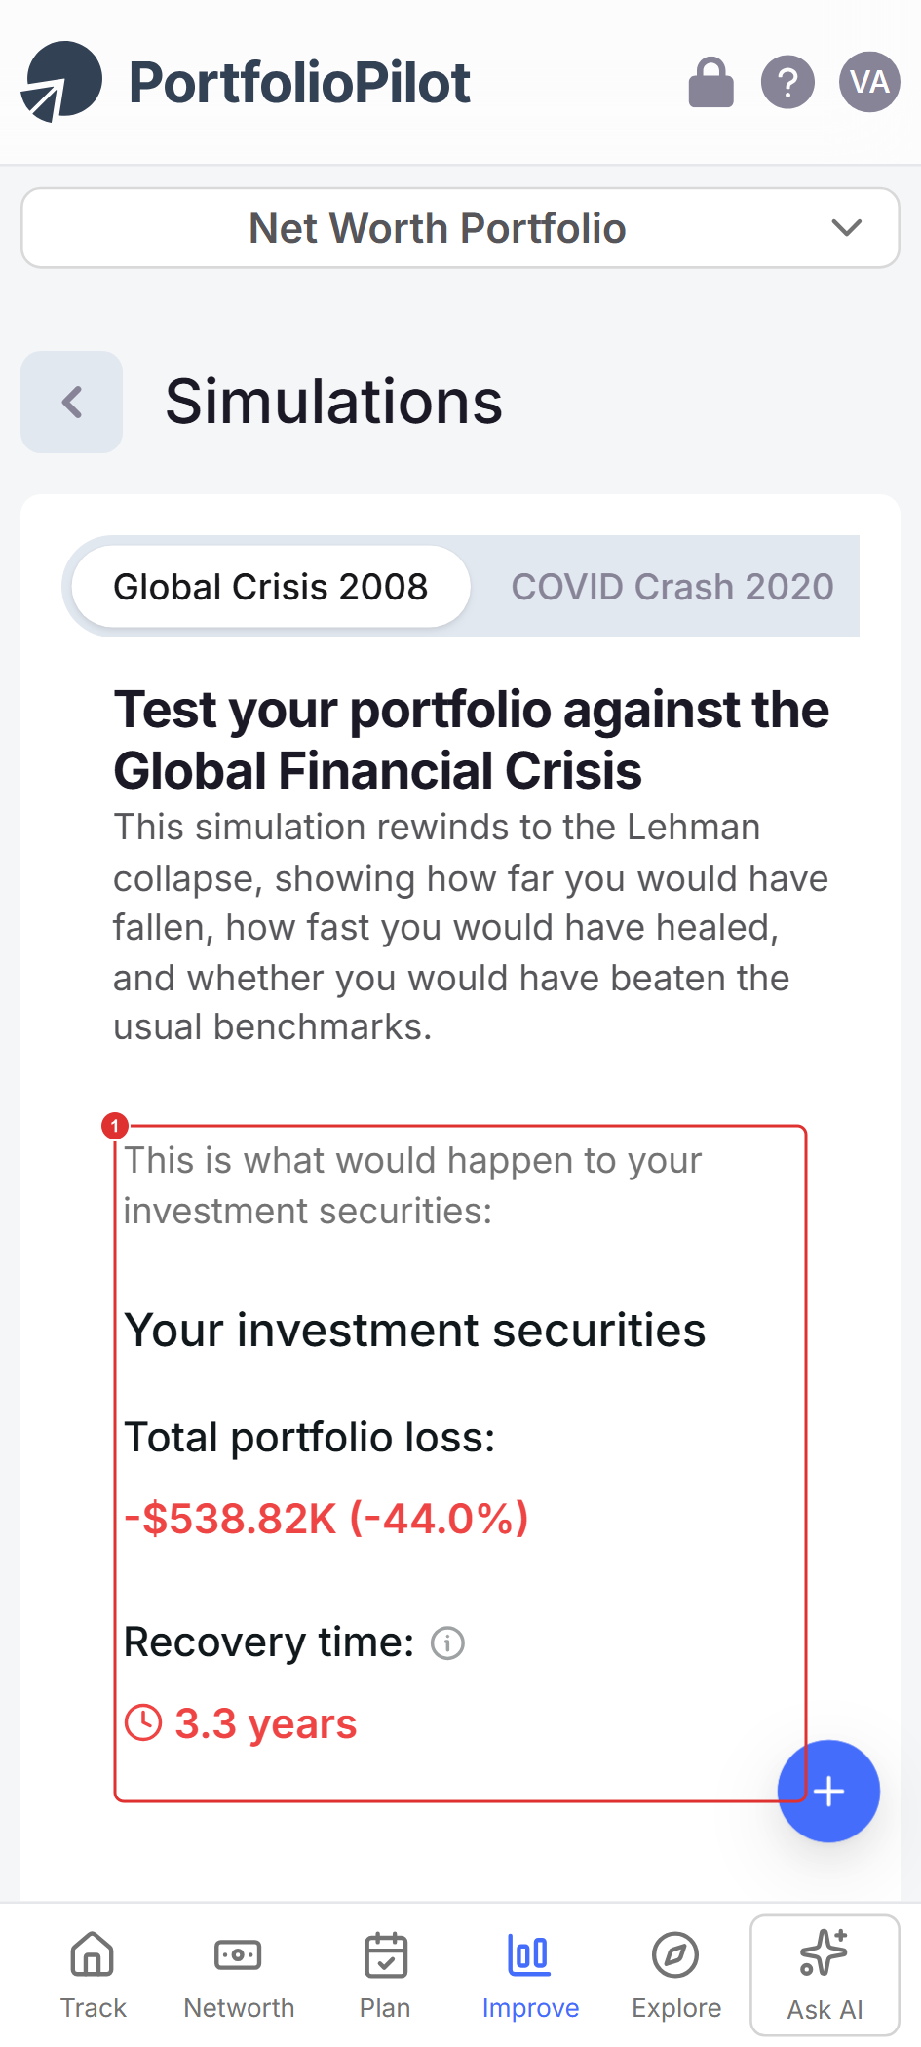
Mobile view: the result stacks vertically: your loss and recovery time first, benchmarks and chart below. Figures shown are illustrative.
Switch between the Drawdown and Cumulative views
The chart has two views, and you switch between them with the Drawdown / Cumulative toggle above it (1):
- Drawdown (the default) shows how far below its previous peak the portfolio was at each point, the depth of the fall.
- Cumulative shows the full return path over the episode, so you can see the drop and the recovery together, alongside the two benchmarks.
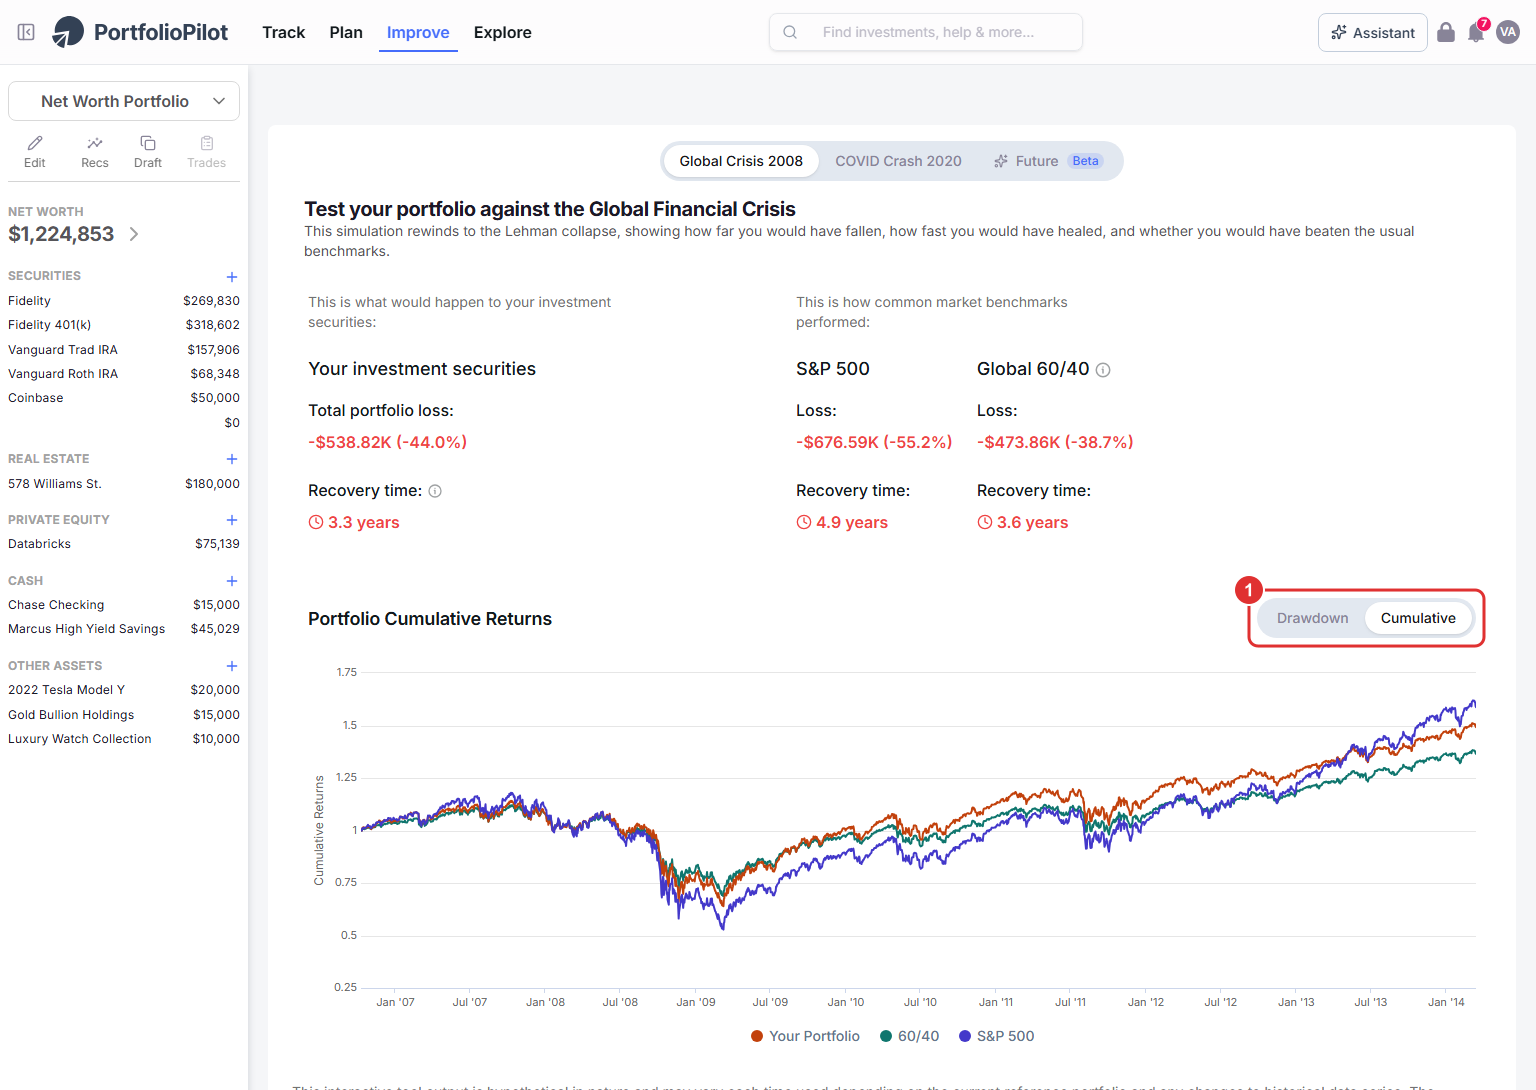
Use the Drawdown / Cumulative toggle to flip between the depth of the fall and the full return path. Figures shown are illustrative.
Imagine any future: the Future tab
History is only part of the picture. The Future tab lets you stress-test a portfolio like yours against any scenario you can describe. Type a future you are worried about into the scenario box (1), or tap one of the example prompts (2), such as "What if interest rates hit 10%?" or "What if there is a global recession?".
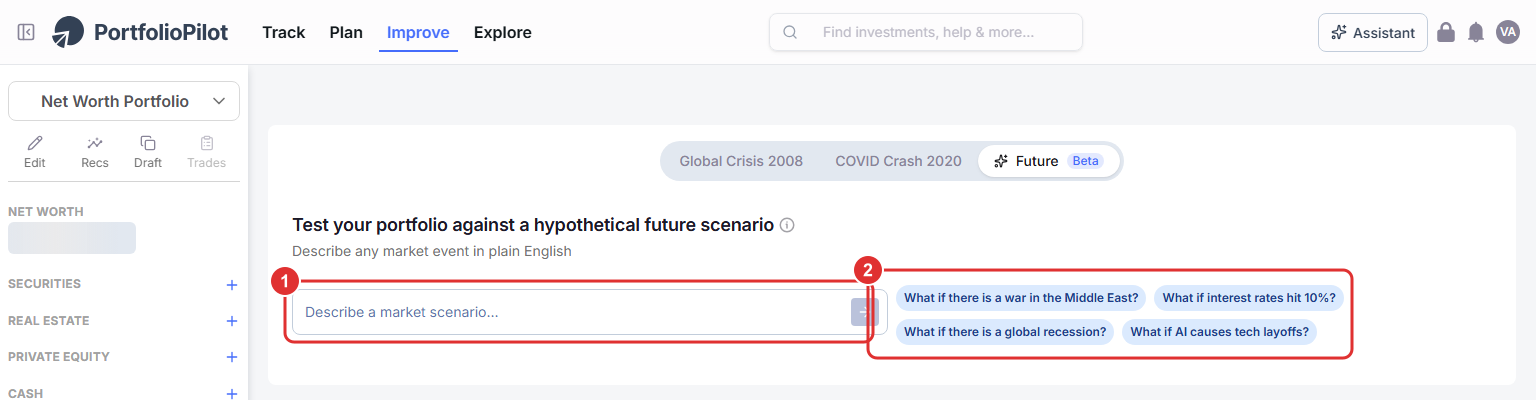
Describe any future in plain English, or tap an example prompt, and PortfolioPilot simulates it against a portfolio like yours.
After a short processing step, you get a full report for a portfolio like yours: a Projected Portfolio Impact, the expected gain or loss over the next twelve months (1), a quarter-by-quarter breakdown explaining what happens in each quarter (2), a 12-month projected-performance chart, and a written Simulation Analysis below.
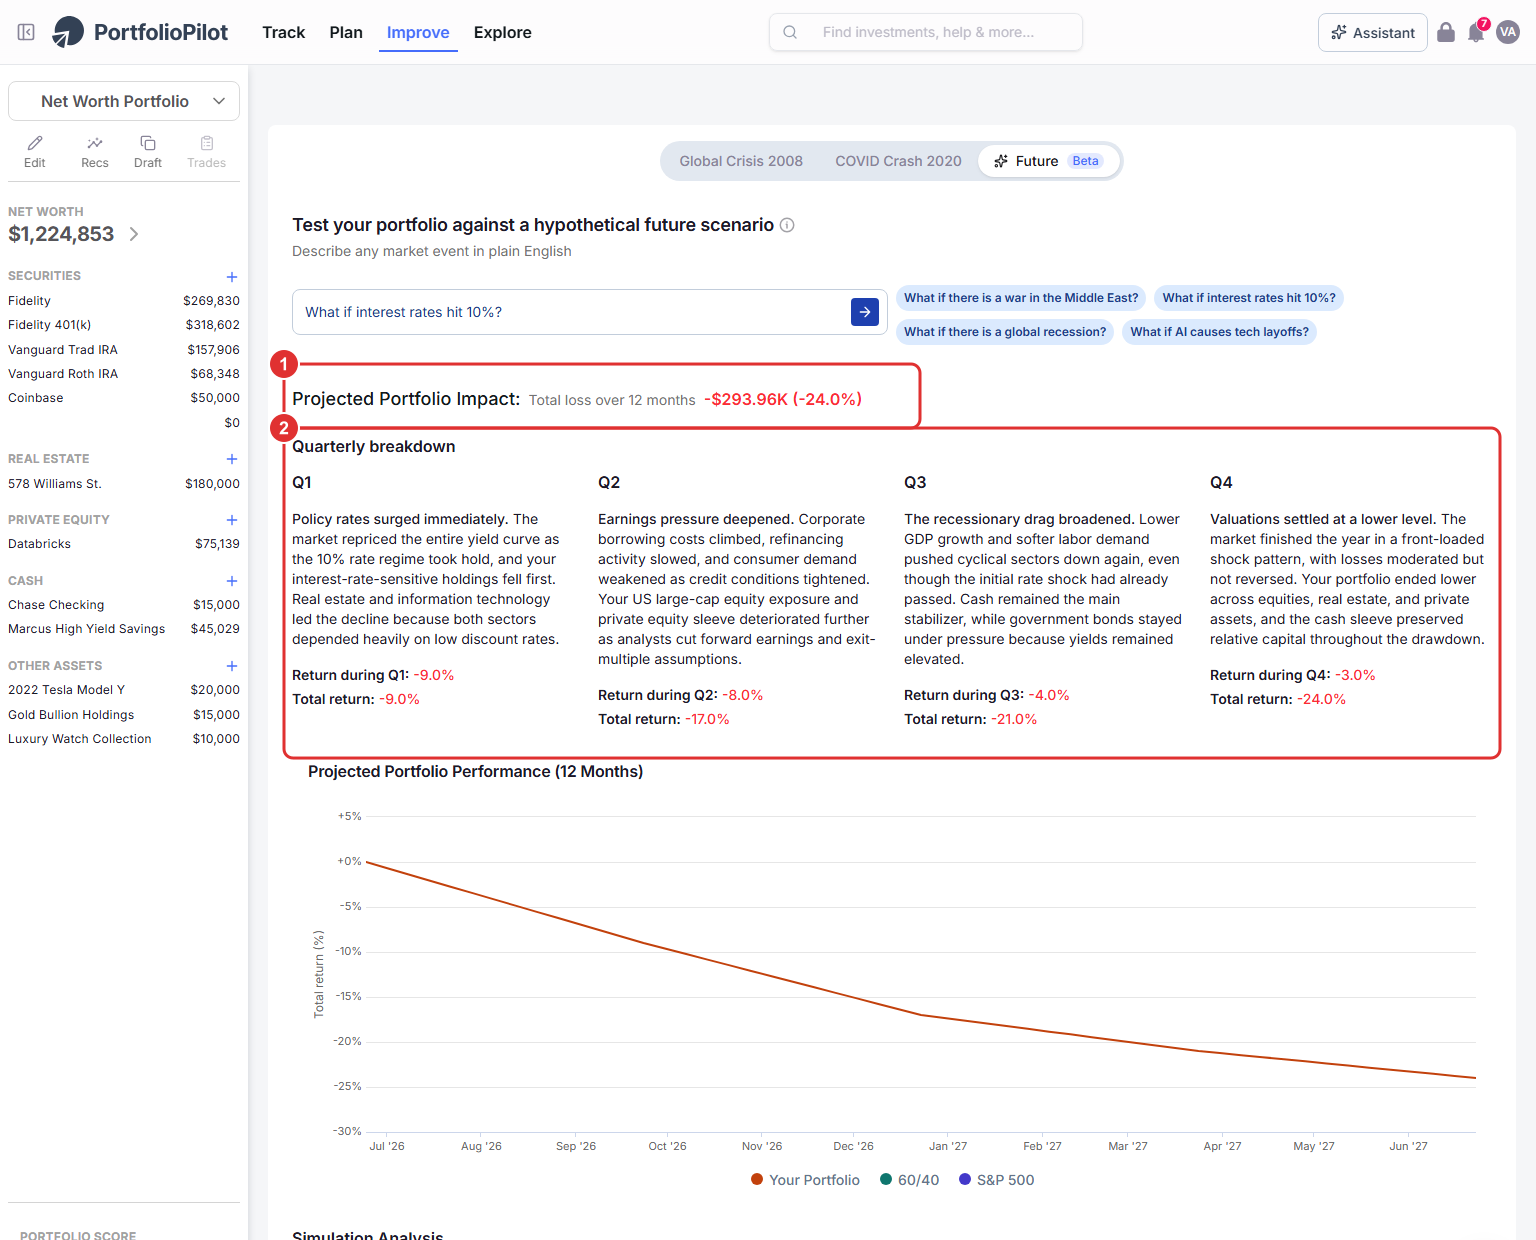
The Future simulation returns a projected 12-month impact for a portfolio like yours, broken down quarter by quarter. These are forward-looking, illustrative estimates, not advice or a guarantee. Figures shown are illustrative.
On a phone, the scenario box and prompts sit at the top, and the Projected Portfolio Impact (1) appears just below once the simulation finishes.
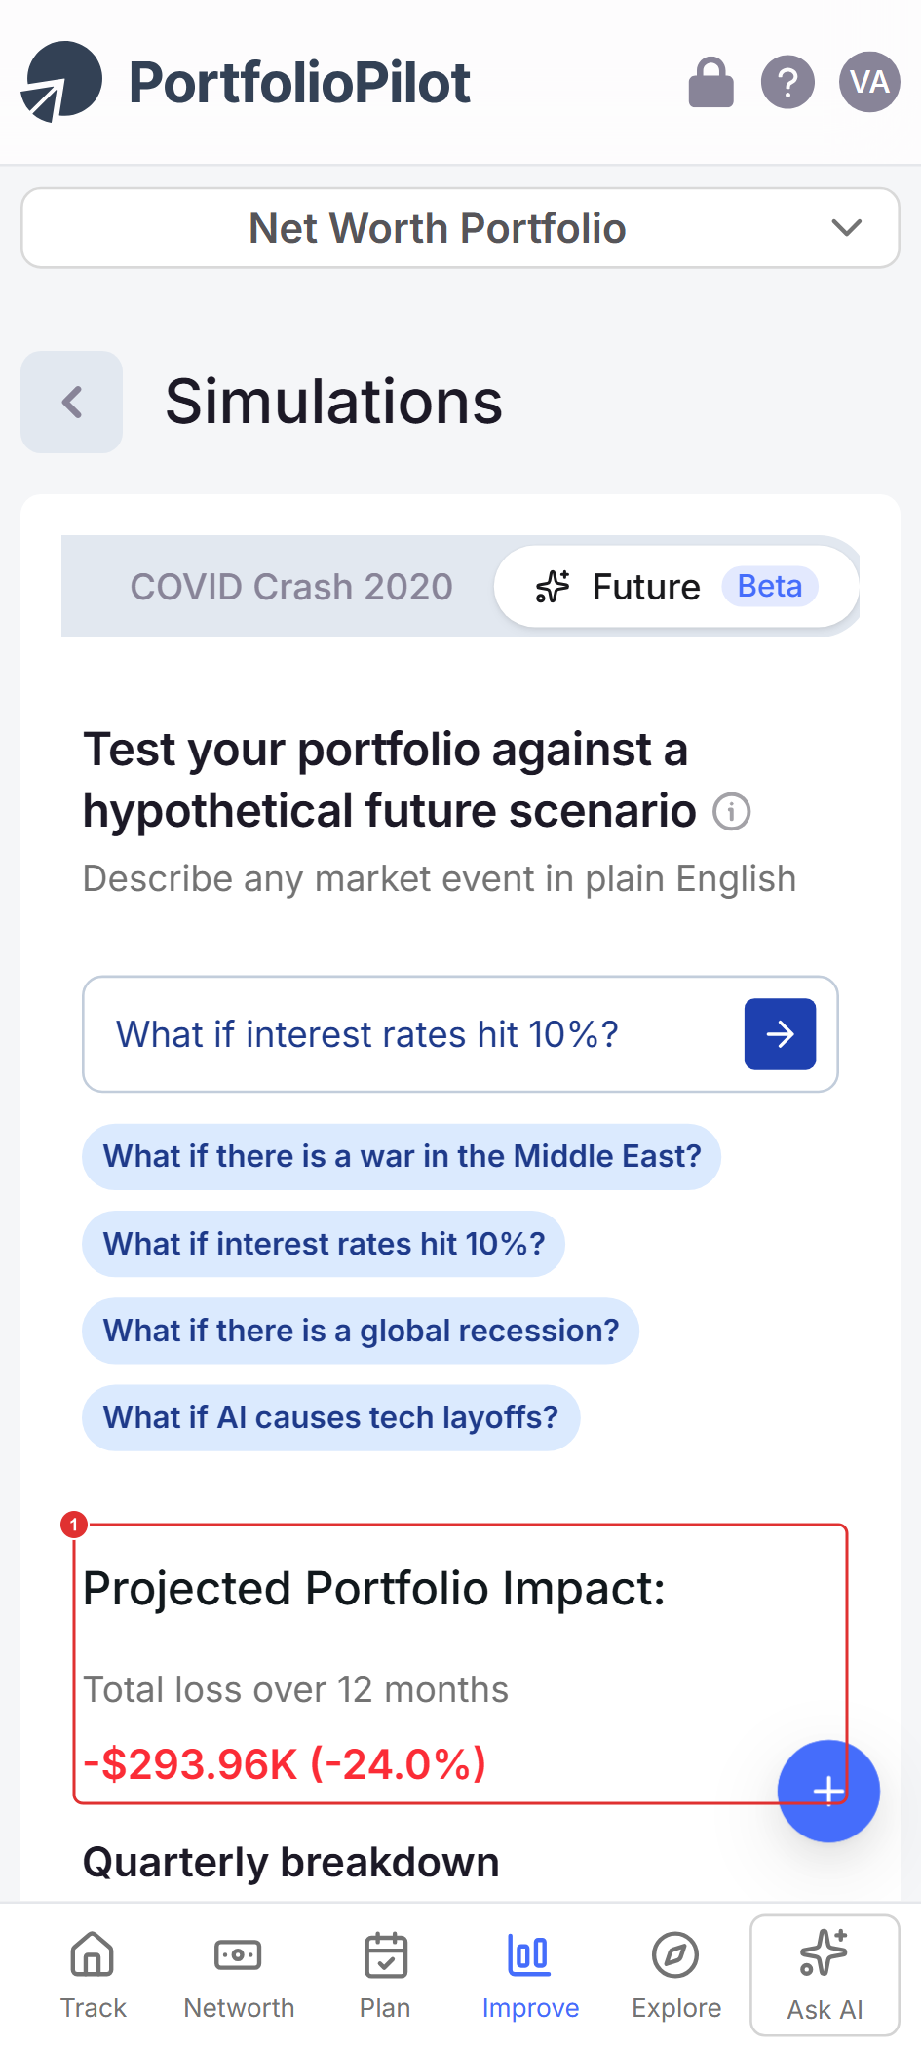
Mobile view: the scenario prompt at the top, with the Projected Portfolio Impact and quarter-by-quarter breakdown below. Figures shown are illustrative.
Keep in mind: The Future simulation models hypothetical scenarios from simplified assumptions. Its results are illustrative, may vary widely, and are not financial advice or a prediction of what will happen. Use it to understand the shape and direction of a risk, not as a forecast of exact returns, and never as the sole basis for an investment decision.
Connect a shock to your retirement plan
A crisis simulation answers "how bad could one moment be?" To answer "will my plan survive it?", pair it with Retirement Planning. Open Plan > Retirement Planning, where PortfolioPilot runs 1,000 simulations of your future across many market conditions and reports the share that succeed (1). Below the chart, Run what-if scenarios (2) lets you model moves like delaying Social Security or retiring earlier over your whole time horizon. A crisis that looks frightening on its own may barely move a long, well-diversified plan; or a crash early in retirement may matter far more than the same crash decades later.
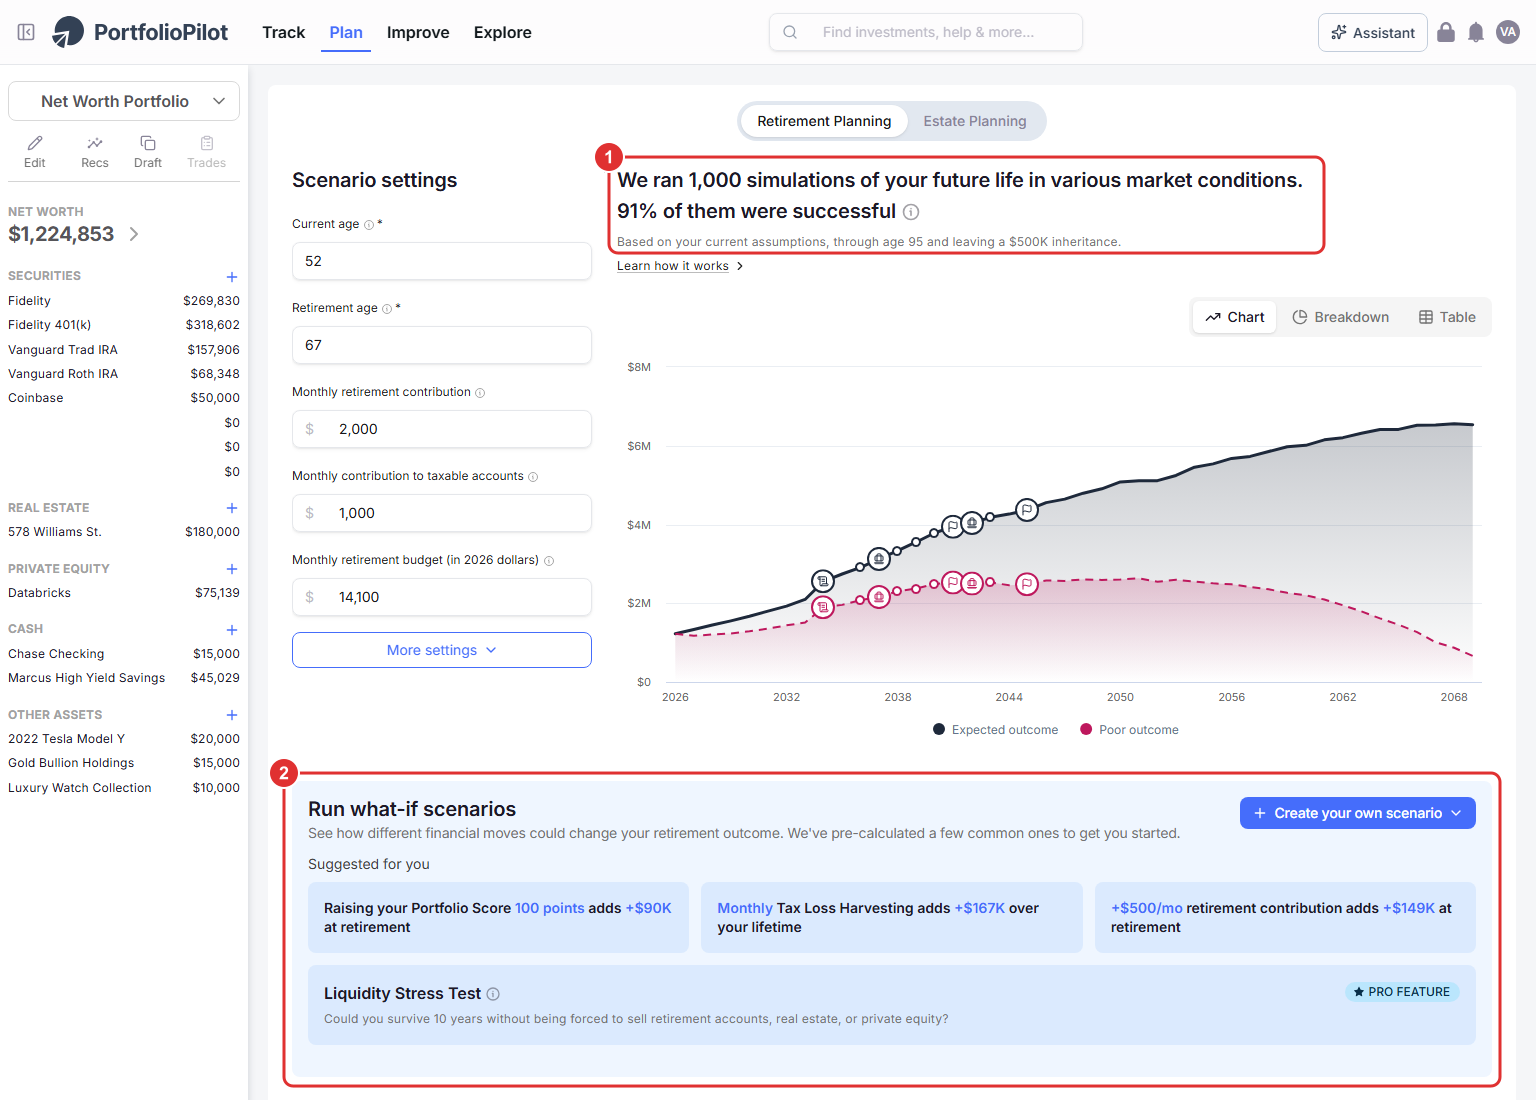
Retirement Planning runs 1,000 simulations across market conditions and lets you model what-if scenarios, the long-term complement to a single-crisis simulation. Figures shown are illustrative.
On a phone, the same success rate and chart appear at the top (1), with the what-if scenarios below as you scroll.
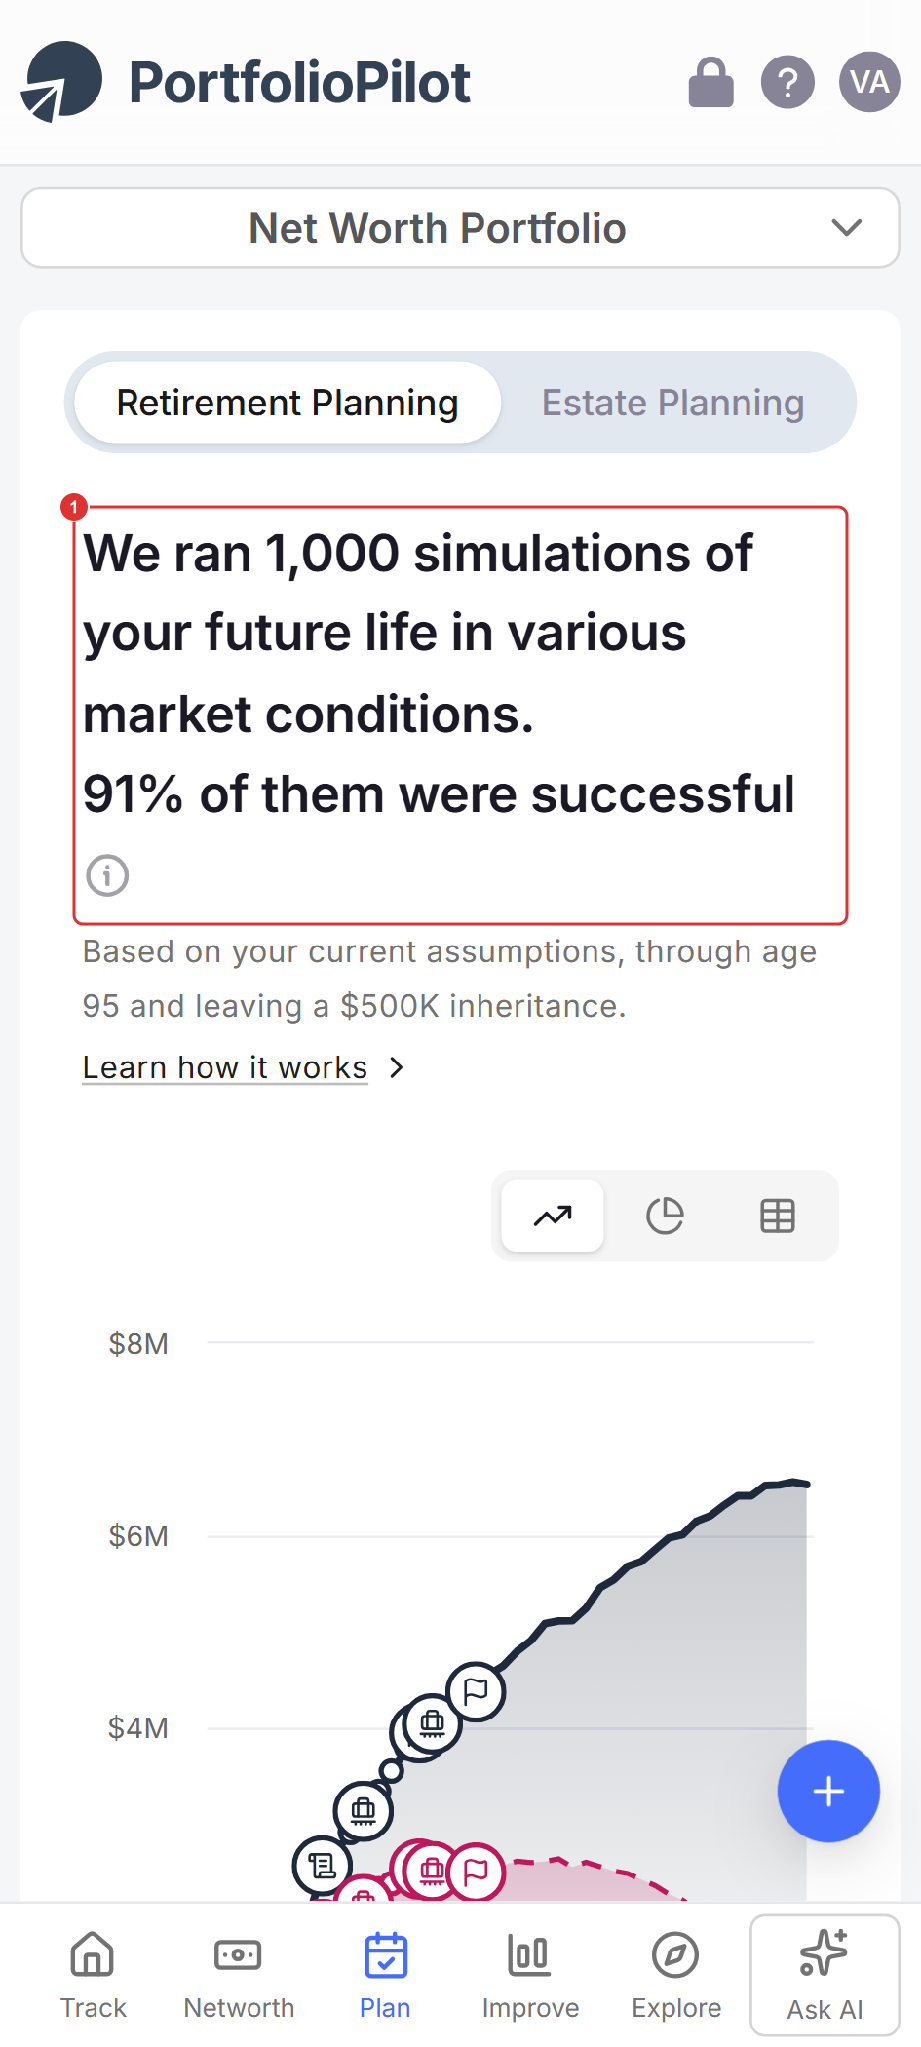
Mobile view: the 1,000-simulation success rate and projected-wealth chart at the top, with what-if scenarios below. Figures shown are illustrative.
The sections that follow, How the simulation works, Common use cases, and Next steps, are background reading rather than steps to complete.
How the simulation works
A proxy portfolio, not your exact holdings
Because you likely hold assets that didn't exist in the crisis you picked, PortfolioPilot doesn't replay your exact holdings. It matches your allocation by country, sector, and asset class and replays the crisis on a portfolio with the same macro profile, measuring the resilience of your overall mix rather than individual securities.
It controls for survivorship bias
Modeling that macro profile, rather than only the companies that still exist today, keeps past performance honest. That is why the maximum loss is the number to watch: markets are risky and do not grow in a straight line.
How the Future tab works
For a scenario you type, PortfolioPilot constructs the macro conditions, traces the knock-on consequences, pulls on historical context, and projects a 12-month path for a portfolio like yours.
Common use cases
How bad could 2008 have been for me?
Open the Global Crisis 2008 tab and compare your Total portfolio loss and Recovery time with the S&P 500 and Global 60/40 benchmarks. If a portfolio like yours fell harder or recovered slower than you are comfortable with, that is your signal to improve your Downside Protection.
What if interest rates hit 10%?
Switch to the Future tab, tap that example prompt or type your own, and review the Projected Portfolio Impact and the quarter-by-quarter breakdown. It won't tell you whether rates will hit 10%, but it shows how exposed a portfolio like yours is if they do.
Will a crash early in retirement break my plan?
Use a crisis or Future simulation to size the shock, then open Retirement Planning and check whether your 1,000-simulation success rate still holds up.
Next steps
- Tutorial: Retirement Planning. Put any single shock in the context of your whole plan with 1,000 simulations and what-if scenarios.
- Tutorial: Portfolio Score. The Downside Protection component is exactly the resilience a crisis simulation stress-tests; improve it directly.
- Tutorial: Personalized Recommendations. Turn the shocks you simulated into specific, prioritized actions.
- Tutorial: Import Your Net Worth. The simulation is only as accurate as the portfolio behind it; make sure every account is in.
- Tutorial: Tax Optimization. Improve after-tax outcomes alongside your portfolio's resilience.
Global Predictions provides investment advice only through its internet-based application, PortfolioPilot, and only to individuals who are advisory clients of Global Predictions pursuant to written advisory Client Agreements ("Advisory Services"). The publicly available portions of the Platform (i.e., the sections of the Platform that are available to individuals who are not party to a Client Agreement, including globalpredictions.com and portions of portfoliopilot.com) are provided for educational purposes only and are not intended to provide legal, tax, or financial planning advice. To the extent that any of the content published on publicly available portions of the Platform may be deemed to be investment advice, such information is impersonal and not tailored to the investment needs of any specific person. Nothing on the publicly available portions of the Platform should be construed as a solicitation or offer, or recommendation, to buy or sell any security. All charts, figures, and graphs on the publicly available websites are for illustrative purposes only. Before investing, you should consider whether any investment, investment strategy, security, other asset, or related transaction is appropriate for you based on your personal investment objectives, financial circumstances, and risk tolerance. You are also encouraged to consult your legal, tax, or investment professional regarding your specific situation. Registration does not imply a certain level of skill or training. Investing involves risk. The value of your investment will fluctuate, and you may gain or lose money.
The contents of the Platform may contain forward-looking statements that are based on management's beliefs, assumptions, current expectations, estimates, and projections about the financial industry, the economy, or Global Predictions itself. Forward-looking statements are not guarantees of the underlying expected actions or future performance and future results may differ significantly from those anticipated by the forward-looking statements. Therefore, actual results and outcomes may materially differ from what may be expressed or forecasted in such forward-looking statements.
Case studies presented are hypothetical scenarios and intended for illustrative purposes only. They do not represent an actual client, investment or experience, but rather are meant to provide an example of the intended investment process and methodology. An individual's experience may vary based on his or her circumstances. There can be no assurance that the Firm will be able to achieve similar results in comparable situations. No portion of this case study is to be interpreted as a testimonial or endorsement of the Firm's investment advisory services. The information contained herein should not be construed as personal investment advice.
Note: our use of the term AI refers to all artificial intelligence models used including large language models, proprietary economic models that incorporate regression or dynamic factors, and machine learning methods like supervised learning. For more information, see our disclosures at globalpredictions.com/disclosures.
The Simulations page, including both the historical crisis scenarios and the Future simulation, is part of the free plan. The Liquidity Stress Test inside Retirement Planning is a Pro feature, available with a 10-day free trial, no credit card required.
