Expected Return Forecaster - Tool

¹ Displayed results are hypothetical simulations based on user inputs. They are not predictions or guarantees of future performance.
Key Takeaways
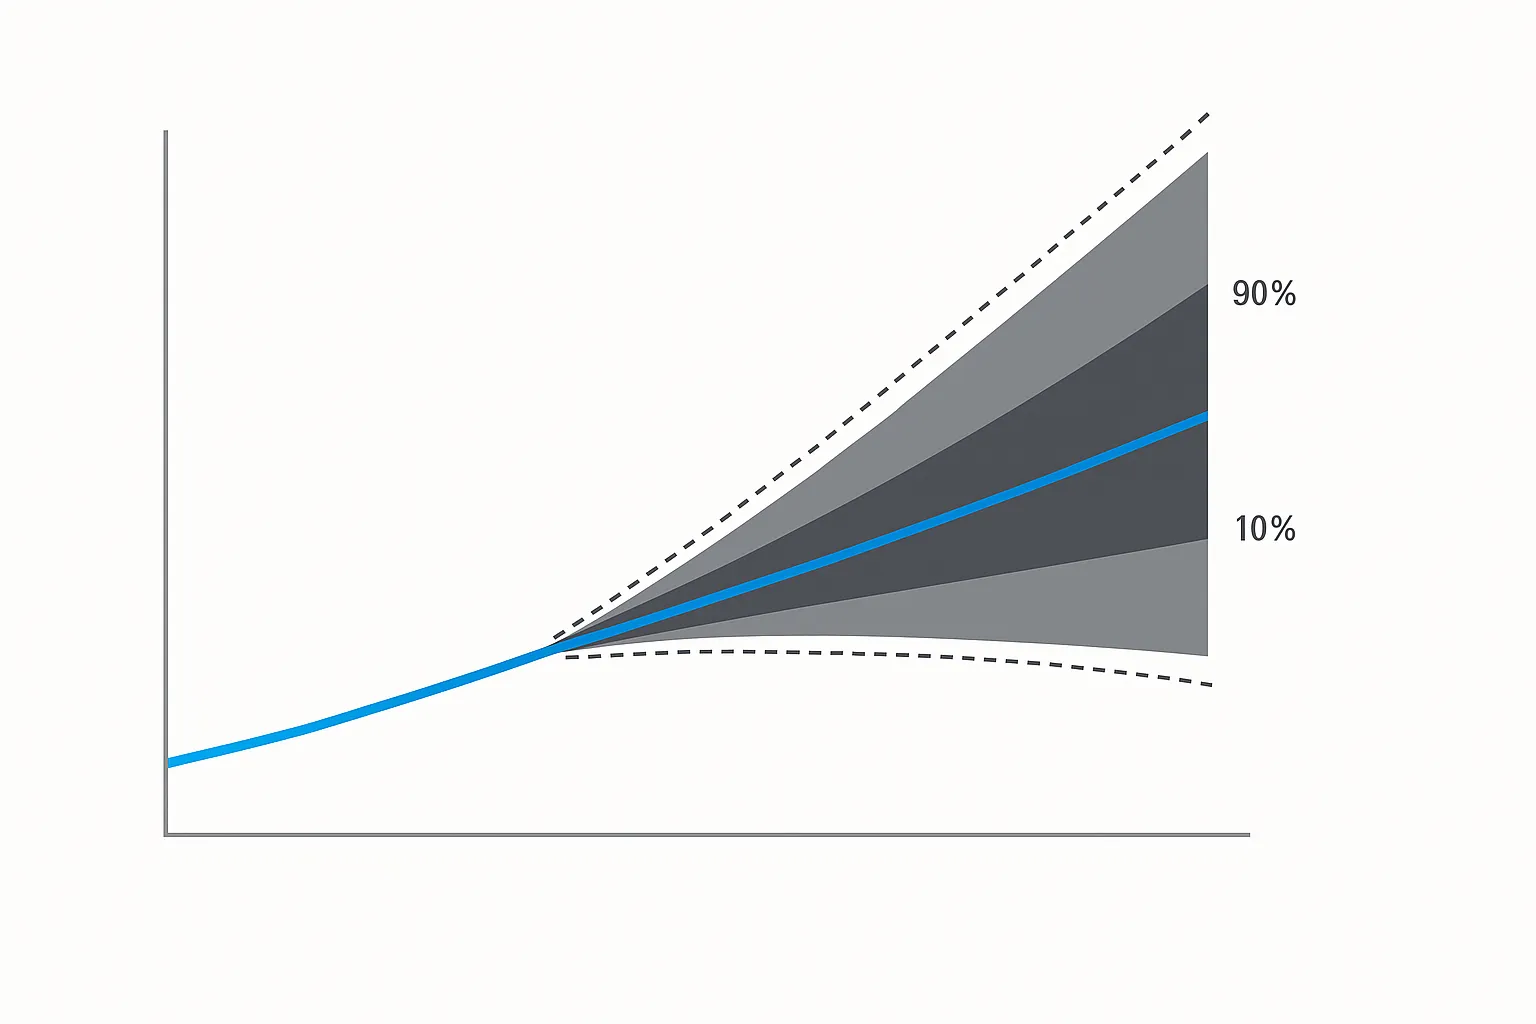
- Ranges beat single numbers. A probabilistic “cone” reflects how markets can overshoot and undershoot any average. (Damodaran data shows the spread is wide year to year.)
- Monte Carlo matters. Simulating thousands of paths (commonly using geometric Brownian motion) better captures uncertainty than straight-line compounding; it’s standard practice in professional analysis.
- Inputs drive outputs. Expected return, volatility, horizon, and contribution pattern shape the cone’s median (p50) and bands (e.g., p10/p90).
- The cone helps visualize how different saving, rebalancing, or withdrawal approaches might perform across a range of hypothetical outcomes.
These visuals are designed to support planning discussions, not to estimate or imply likely investment results.
Why a Range beats a “7%” line
Annual market returns vary widely. History shows some years deliver rallies north of 30%, while others cut balances sharply; the long-term average hides that path. Using ranges preserves the “so what?” that investors actually face: how often goals might be met or missed under uncertainty. Damodaran’s dataset of US stocks, dating back to the late 1920s, illustrates just how wide the annual dispersion can run - for example, the return on the S&P 500 (including dividends) hit +43.81% in 1928 and –43.84% in 1931.
Quick sanity check inside the tool
- p50 (median): what happens in the middle of simulated outcomes.
- p10/p90 bands: a conservative/optimistic envelope - not predictions, but guardrails around uncertainty.
- Cone shape: widens with time because small return differences compound into large dollar gaps.
Manage allocation, diversification, and risk exposure across holdings.
Under the Hood: What the Expected Return Forecaster Simulates
The tool lets a person set expected return (μ), volatility (σ), horizon, and contribution cadence. The engine then runs thousands of randomized return paths. In practice, finance teams often implement this with geometric Brownian motion and Monte Carlo simulation - an approach common in CFA-level analysis, materials, and investment texts - so the output reflects a distribution of possible future values rather than a single line.
- Why this matters: Planning benefits from understanding probabilities. A family deciding between buying a home or extending retirement savings benefits by seeing how often the plan clears a target, not just the average line that almost never shows up in real life.
Reading the Cone: Turning a Chart into Decisions
- Median vs. bands. If the p50 path reaches a college or retirement target, that’s encouraging - but the p10 band reveals whether the plan is fragile. If p10 falls short, the household may consider higher savings, a longer horizon, or lower risk.
- Contributions and cadence. Switching from annual lump sums to monthly contributions narrows the cone slightly because cash enters more steadily (less timing risk). That small operational choice can matter when markets swing hard.
- Volatility drag. Higher σ can generally pull down the long-run median outcome even when the arithmetic average return is unchanged. The point is practical: portfolios with the same expected average return but different volatilities will show different median outcomes in simulations - another reason ranges beat single numbers.
- Sequence risk call-out. For retirees, the order of returns generally matters as much as the average. Research summarized by Morningstar shows that large losses in the first years of retirement tend to reduce sustainability, even if later returns are solid. A cone makes that risk visible.
This forecast uses simulated returns based on user inputs and simplified market assumptions. Results are illustrative and educational only and do not represent actual or guaranteed investment outcomes. Simulations exclude taxes, fees, and market shocks. This tool does not provide investment, tax, or financial advice.
PortfolioPilot does not provide personalized investment, tax, or financial advice through this tool. Users should consult qualified professionals before making financial decisions.
How optimized is your portfolio?
PortfolioPilot is used by over 50,000 individuals in the US & Canada to analyze their portfolios of over $40 billion1. Discover your portfolio score now:

Analyze your entire net worth
360° portfolio analysis, AI Assistant, and personalized recommendations guided by our Economic Insights Engine.