Fee Impact - Tool

Hypothetical results for illustration only. Not predictions of actual returns or fees. Actual fee structures, market returns, and investor behavior may differ materially from these simplified illustrations.
Key Takeaways
- Fees compound like negative interest - small percentages can become large dollar gaps across decades.
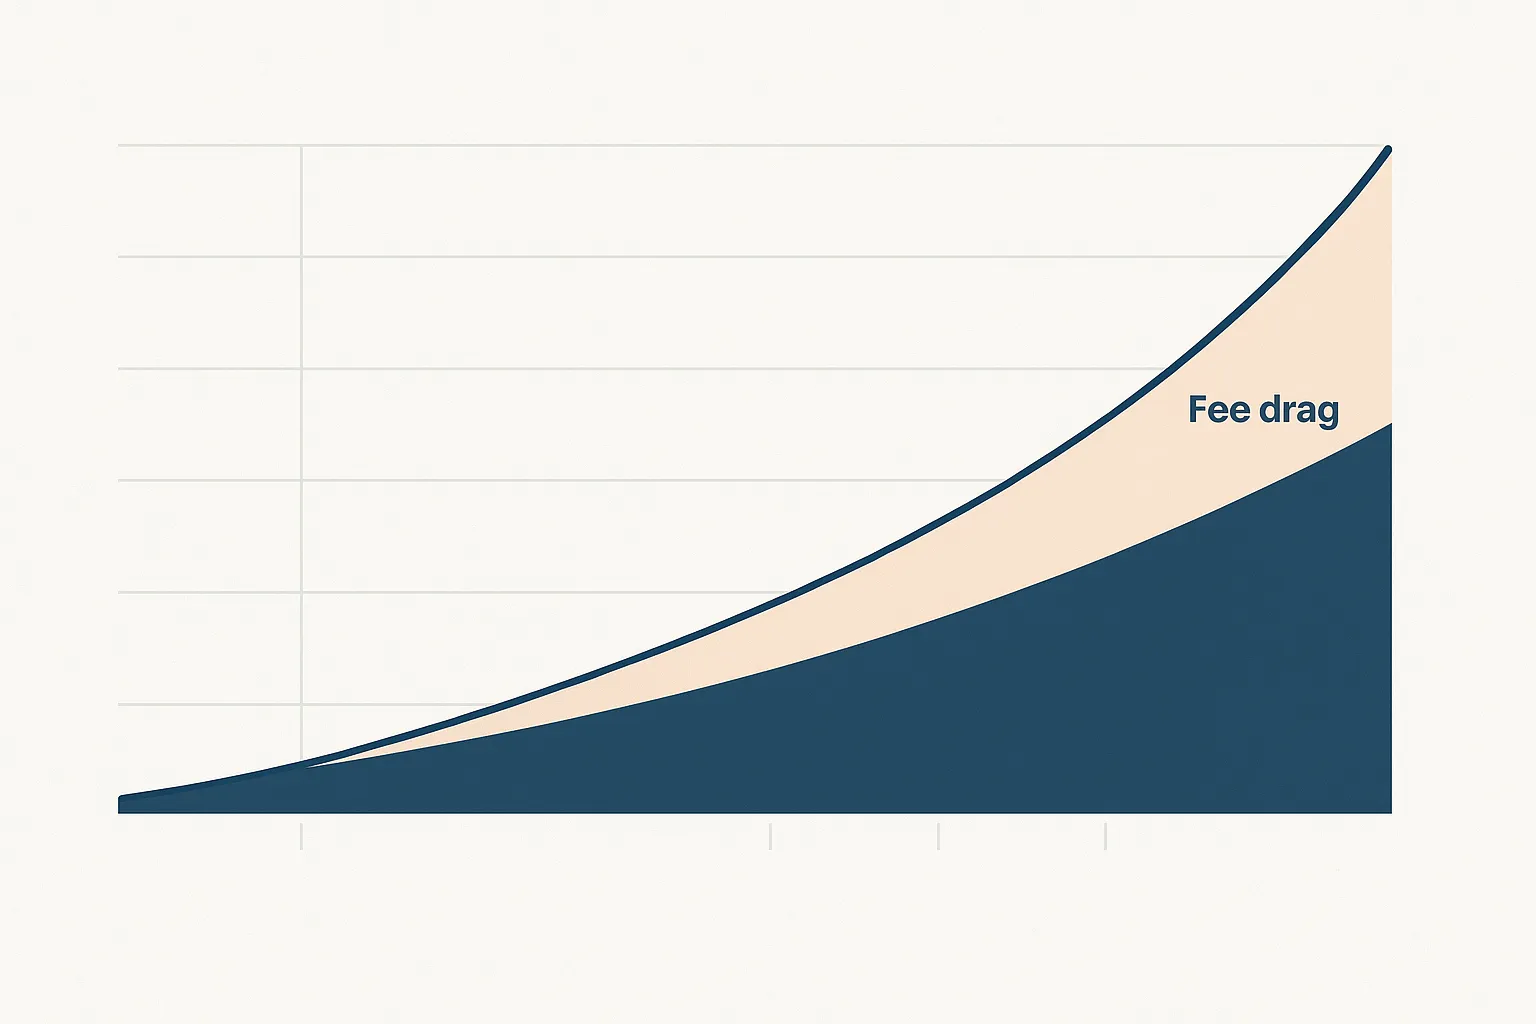
- “Fee drag” is measurable: compare “with fees” vs. “no fees,” tally cumulative dollars paid, and track the wealth gap year by year
What “Fee Drag” Really Means
Fees generally aren’t one-time; they’re taken annually from the balance before returns compound. That generally turns a percentage into a persistent headwind. Regulators illustrate that even a one-percentage-point fee difference can leave otherwise similar portfolios thousands of dollars apart over time because returns compound on a smaller after-fee base each year. So what? Understanding fee impact helps investors see how costs influence long-term outcomes without altering their market exposure.
The three numbers that matter
When assessing fees, focus on:
- % of assets each year (expense ratio or advisory fee)
- $ fees over time (cumulative dollars paid)
- Ending balance gap (“with fees” vs. “no fees”)
Manage allocation, diversification, and risk exposure across holdings.
How to Read the Fee Impact Tool
The tool takes the inputs that many investors actually control:
- Initial investment & annual contribution - establishes the compounding base.
- Expected annual return & horizon - frames the growth path (educational - not a prediction).
- Annual fee - either “% of assets” or flat “$ per year.”
Outputs to watch:
- Hypothetical Portfolio value with fees vs. without fees - the wealth gap is the cost of the fee policy.
- Estimate Total fees paid - cumulative dollars extracted.
- Fee-drag area chart - shows how the gap widens late in the horizon as balances grow.
- Sample benchmark - “A 1% fee cut = +$X over 20 years.”
This interactive tool uses simplified, hypothetical assumptions to illustrate the long-term impact of investment fees. It is for educational and illustrative purposes only and does not predict actual investment performance. Results exclude taxes, trading costs, and market volatility. This tool does not provide investment, tax, or financial advice.
How optimized is your portfolio?
PortfolioPilot is used by over 50,000 individuals in the US & Canada to analyze their portfolios of over $40 billion1. Discover your portfolio score now:

Analyze your entire net worth
360° portfolio analysis, AI Assistant, and personalized recommendations guided by our Economic Insights Engine.