
Tutorial: Explore
Enjoy this short tutorial on how to use Explore, the part of PortfolioPilot where you research the market instead of your own portfolio. Most of the product is built around your accounts; Explore is the opposite. It is your window into how the broader economy is moving, which sectors and countries look strong, how individual stocks and funds stack up, and where the market is behaving unusually, all powered by PortfolioPilot's Economic Insights Engine. This tutorial walks through every part of Explore, from the market overview to the screeners, AI equity research, individual security profiles, anomalies, and the Macro Explorer.
Using Explore, you can:
- Check the market overview: the US downturn probability, inflation, unemployment, and bond yields, plus the top-forecast sectors, countries, and asset classes.
- Screen stocks and funds with structured filters or a plain-English Smart filter, and add any result to a Draft Portfolio.
- Compare funds by expected return, Sharpe ratio, and expense ratio, and find a lower-cost substitute.
- Use AI equity research to turn a theme or thesis into a basket of related securities.
- Open a detailed security profile for any stock, ETF, mutual fund, or cryptocurrency: price history and forecast, the forecast breakdown, macro factor sensitivities, valuation, events, and news.
- See market anomalies: securities and indicators moving unusually versus their expected trend.
- Explore macroeconomic indicators for countries around the world in the Macro Explorer.
Before you start: you do not need to connect any accounts to use Explore. It works the same whether or not you have added a portfolio, because it looks at the market rather than your holdings. If you do want to act on what you find, having a portfolio in place lets you add a security to a Draft Portfolio and see how it would change your overall strategy. To get your accounts in, see Import Your Net Worth.
What you'll find in this tutorial
You do not have to follow these in order. Click any section to jump straight to it, or open Explore in the app to follow along. On a phone, open Explore from the bottom navigation bar.
- Market overview and the Economic Insights Engine
- Screen for stocks
- Screen for funds (ETFs and mutual funds)
- AI equity research
- Explore an individual security
- Market anomalies
- Macro Explorer
Learn more: If a security is missing or the data looks wrong, How Explore is powered, A note on data freshness, Common ways people use Explore, Why this matters, and Next steps.
Throughout, the red markings on each screenshot point to exactly what the text is describing. A (1) in the text matches the 1 badge on the image. Where the phone layout differs, a mobile screenshot follows the desktop one.
Market overview and the Economic Insights Engine
To open Explore, choose Explore in the top navigation bar (next to Track, Plan, and Improve). You land on the market overview, your market dashboard, and unlike the rest of PortfolioPilot, it is not tied to your portfolio. It shows the world around your investments, powered by the Economic Insights Engine. At the top, a plain-English Daily Update sums up what is moving markets today.
(1) The Macro overview gives four headline readings: the US Downturn Probability, US Unemployment Rate, US Inflation (YoY), and the US 10-Year Bond Yield, each with its current level and PortfolioPilot's forecast, so you see not just where things stand but where the engine expects them to go.
(2) Below that, Top sectors, Top countries, and Top asset classes rank where the strongest opportunities are. Each has two columns: Market Exp. (what the broader market expects) and Forecast (PortfolioPilot's own forecast). Choose Expand to see the full lists.
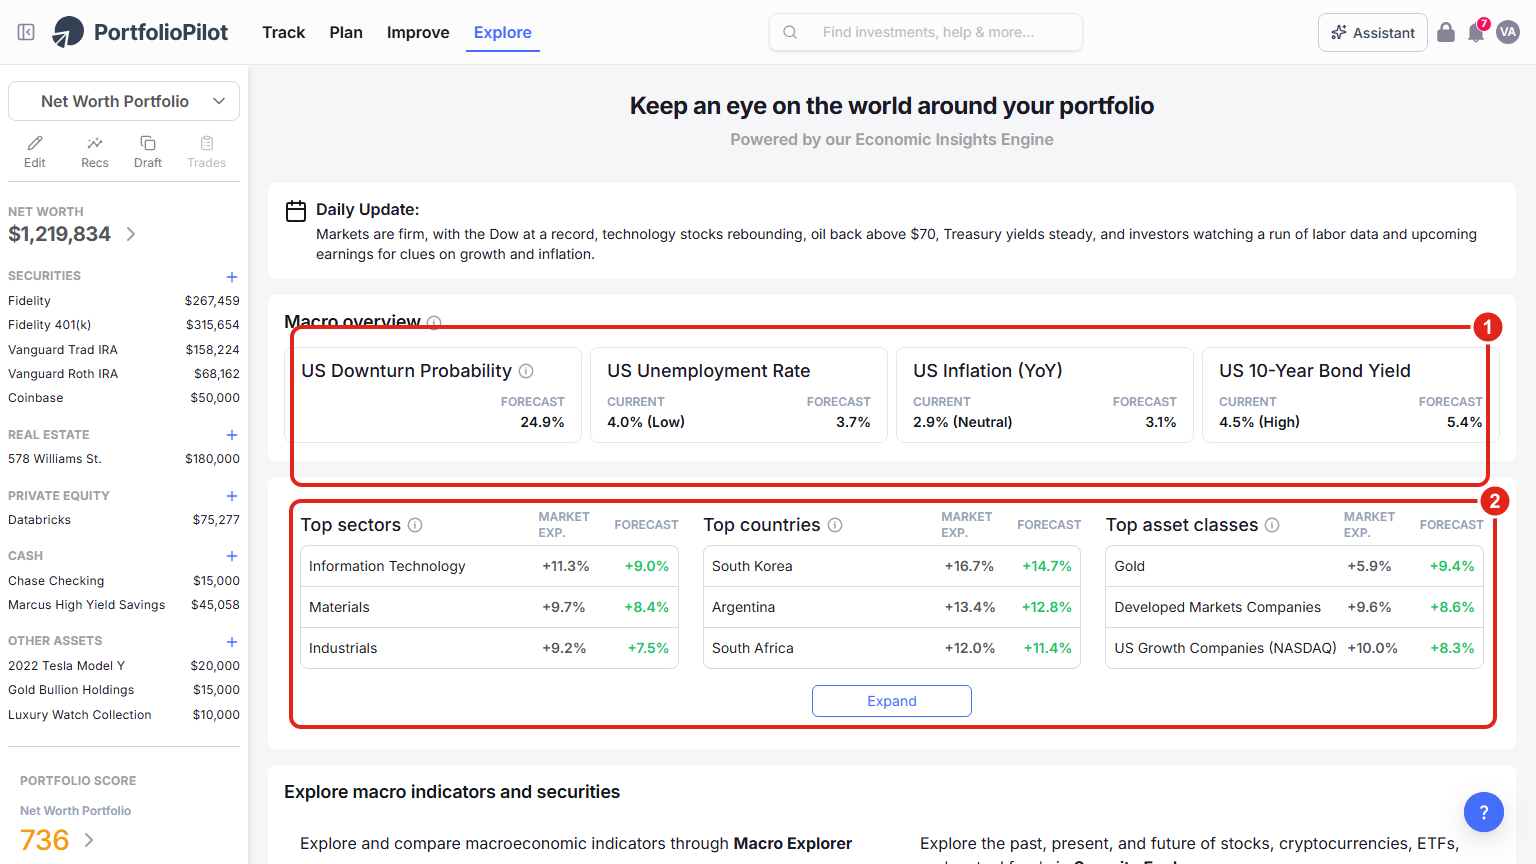
The market overview, powered by the Economic Insights Engine. Figures shown are illustrative.
On a phone, open Explore from the bottom navigation bar. A Popular tools row at the top (1) gives one-tap shortcuts to the Stock Screener, Fund Screener, Anomalies, and AI Equity Research, with the same Daily Update and Macro overview below.
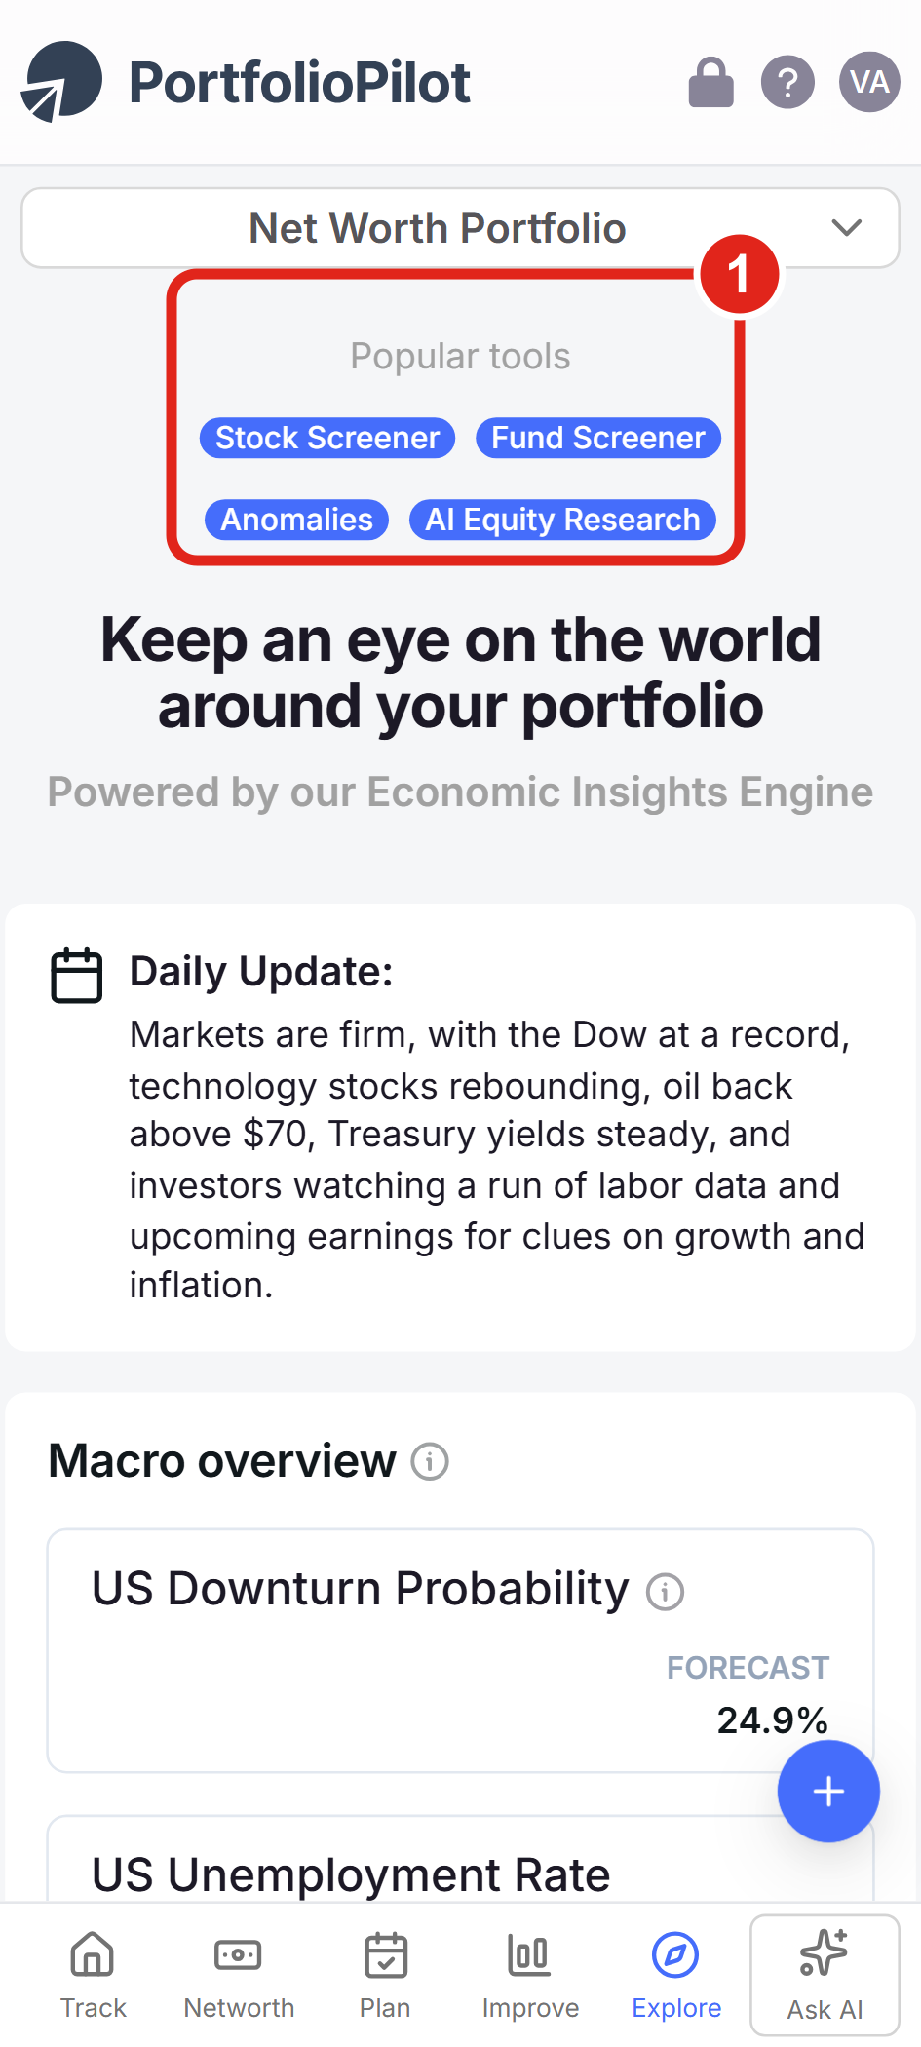
Mobile view: the Popular tools shortcuts at the top of the Explore market overview. Figures shown are illustrative.
Screen for stocks
A screener helps you go from thousands of securities down to the few worth a closer look. Choose Explore stocks to screen individual stocks. There are two ways to narrow the list, and you can combine them:
(1) The Smart filter: type what you want in plain English: for example, "large-cap dividend payers with low volatility", and PortfolioPilot translates it into filters for you. You can also use the structured Sector, Market cap, and Region filters above the table.
(2) The results table compares every match on the numbers that matter: Expected return, Beta, P/E Ratio, Sharpe Ratio, and Volatility. Click any column to sort by it, and use Customize table to choose which columns to show.
(3) When something looks promising, choose Add to draft to drop it into a Draft Portfolio and see how it would change your overall strategy, without touching your real accounts.
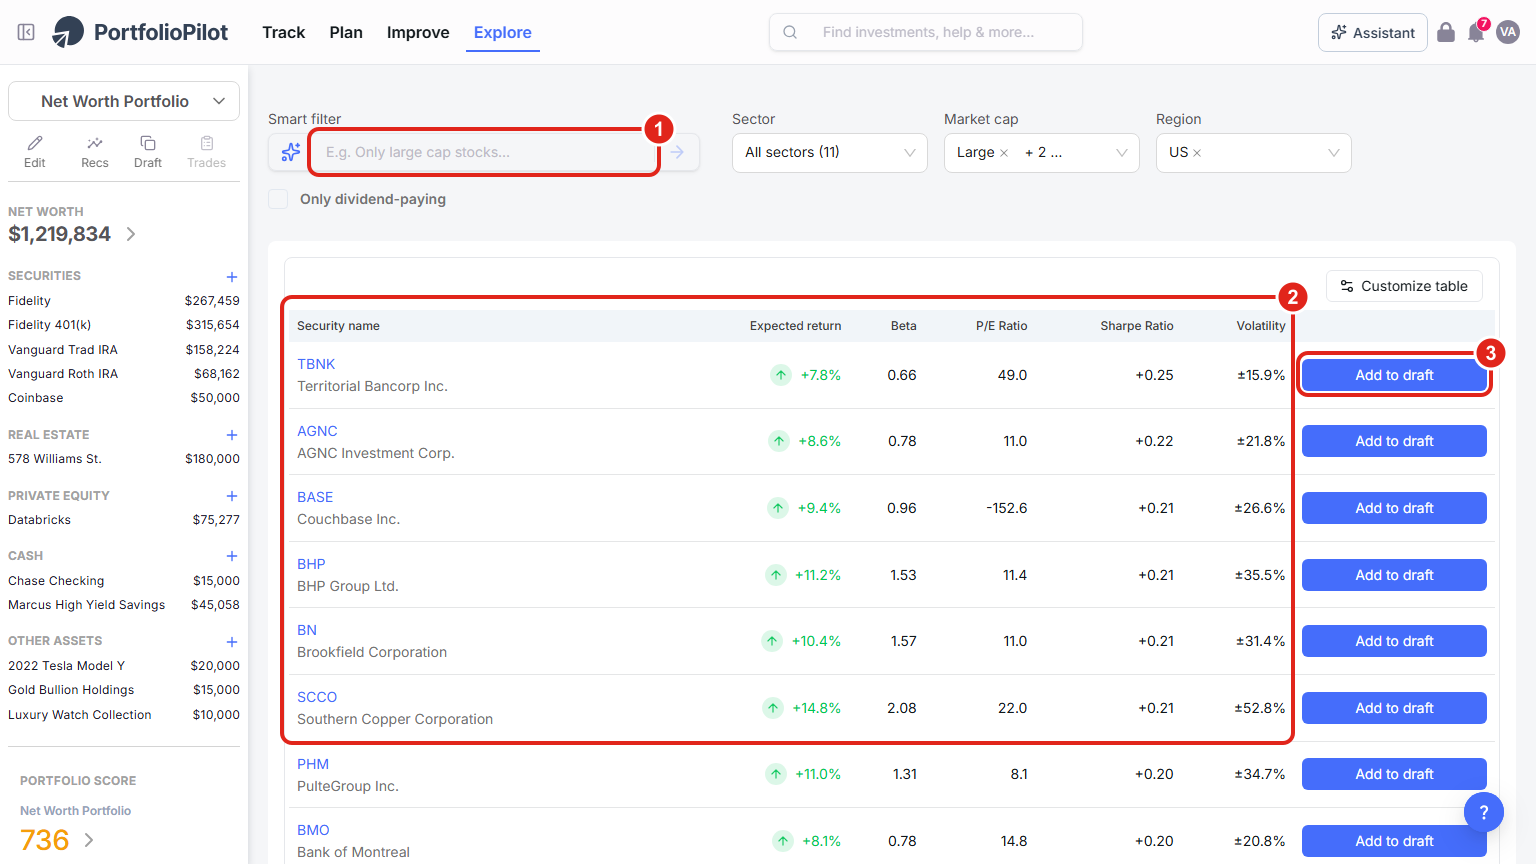
The Stock Screener: describe what you want, compare on the numbers, and add a result to a draft. Results are illustrative.
On a phone, the Smart filter and the Sector, Market cap, and Region filters stack vertically (1), with the results table just below (2). Swipe the table sideways to see every column.
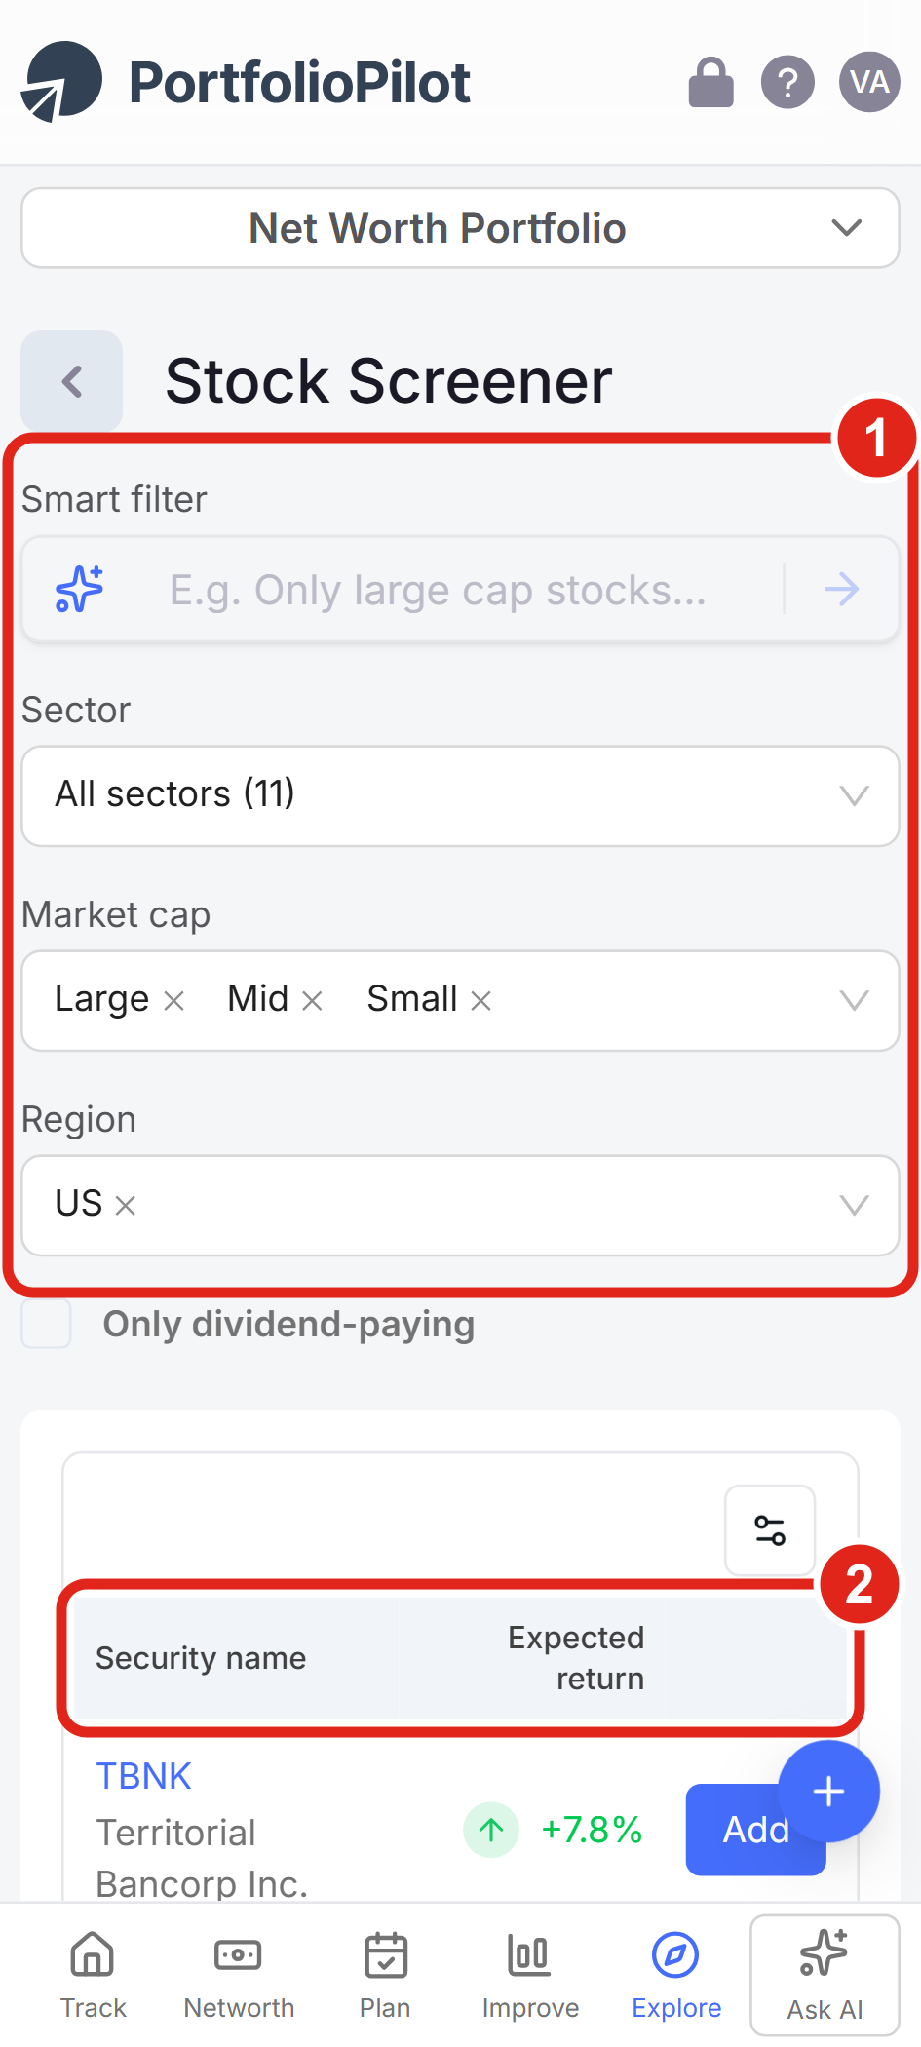
Mobile view: the screener filters stack above the results table. Results are illustrative.
Screen for funds (ETFs and mutual funds)
Choose Explore funds to screen ETFs and mutual funds. It works the same way as the stock screener, with the columns that matter most for funds:
(1) The results table lines funds up on Expense ratio, Expected return, Volatility, Sharpe Ratio, and Inflation exposure. Sort by any of them: by Sharpe ratio for the best risk-adjusted return, or by expense ratio for the cheapest option, and filter above the table by Investment philosophy, Diversified, and Asset class.
(2) Use Customize table to choose which columns you see.
(3) As with stocks, Add to draft drops a fund into a draft so you can test it before you act.
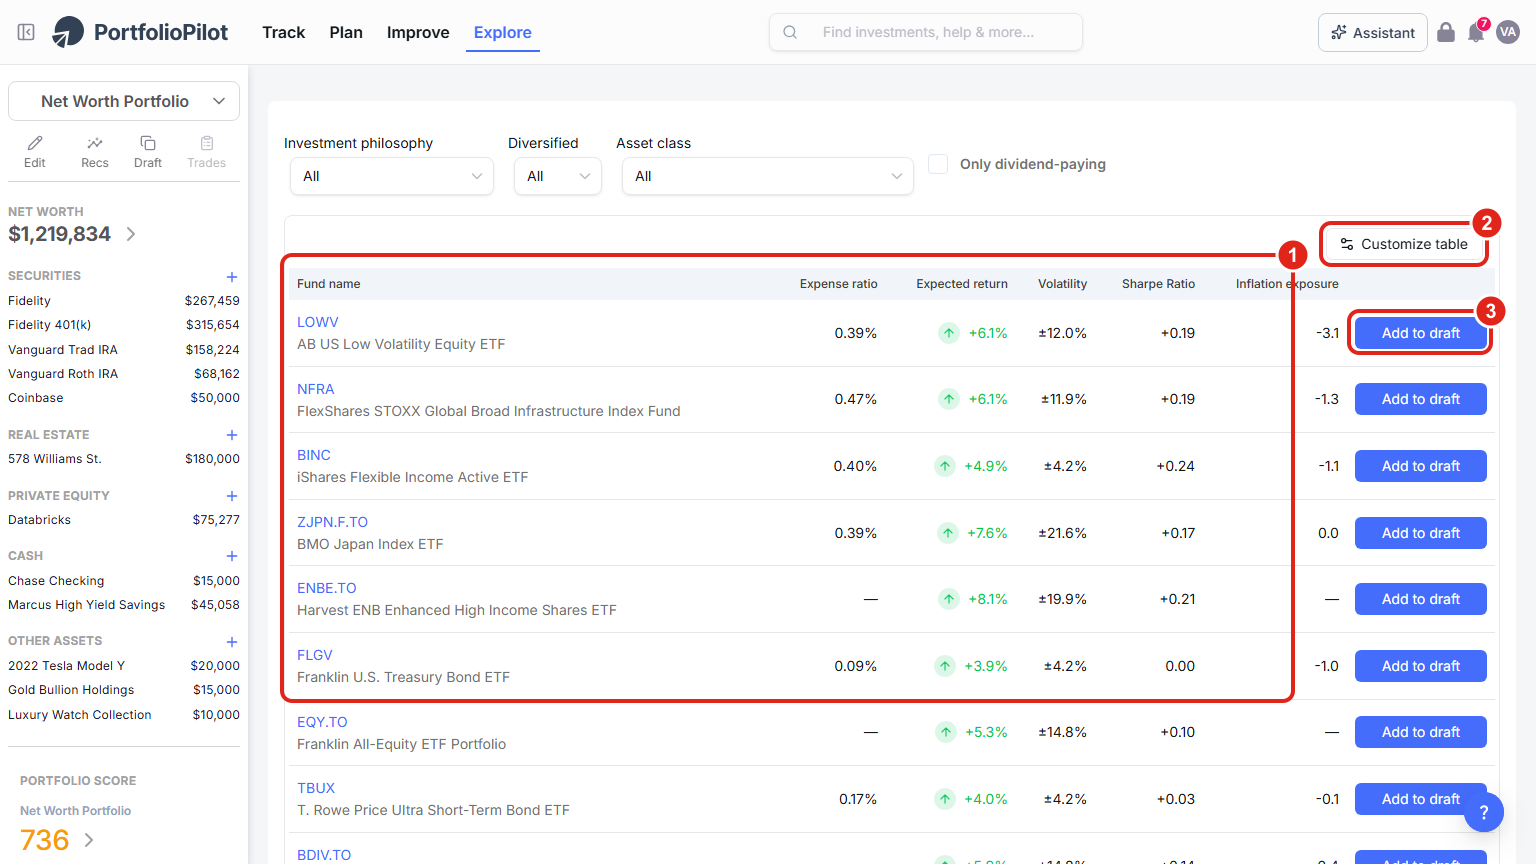
The Fund Screener compares ETFs and mutual funds on the metrics that matter. Funds shown are illustrative.
Find a cheaper substitute: sort the table by Expense ratio, then check that a cheaper fund still has a similar expected return, Sharpe ratio, and asset class. This is the manual version of what the Reduce fees recommendation does automatically.
Compare two funds: because the table already shows several funds side by side, filter to the two you are weighing and read the columns across. For a quick plain-language head-to-head: "Compare VOO and VTI: which has lower fees, and how do they differ?". You can also ask the AI Assistant.
AI equity research
AI equity research lets you start from an idea instead of a filter. It is useful when you have a thesis but not a list of tickers. Open AI equity research to begin.
(1) In the Search query box, describe a theme or thesis in plain English: for example, "companies that benefit from large language models," "emerging fintech," or "makers of canned or non-perishable foods." A list of example queries underneath shows the kinds of ideas that work well.
(2) Choose Generate basket and calculate alpha, and PortfolioPilot returns a basket of related securities, each with how closely it relates to your query and its forecast figures, including an alpha estimate. From there you can open any name in the Security Explorer or add it to a draft.
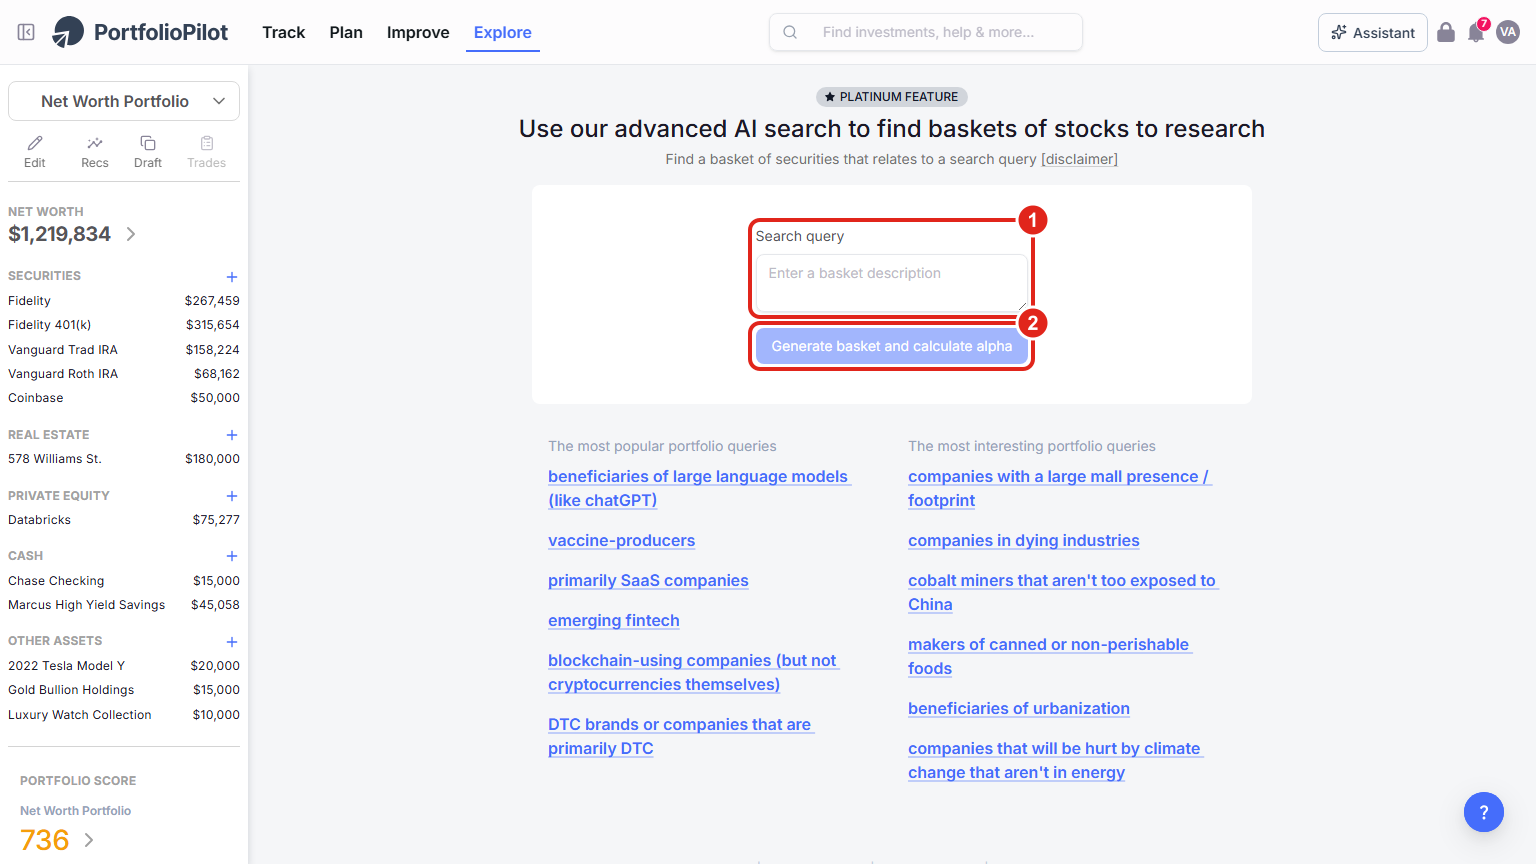
AI equity research turns a theme or thesis into a basket of related securities to research. Output is model-generated and illustrative, not a recommendation.
Good to know: AI equity research is a Platinum (and Pro) feature, and its results are produced by PortfolioPilot's models. They are a starting point for your own research, not a recommendation to buy. See our disclosures.
Explore an individual security
The Security Explorer lets you drill into a single security in depth. PortfolioPilot links tens of thousands of macroeconomic data series to over 50,000 securities: stocks, ETFs, mutual funds, and cryptocurrencies, so almost anything you search for is here. Open the Security Explorer to start.
(1) Start in the Find a security box and search by name or ticker, or pick one of the popular stocks, crypto, ETFs, or mutual funds shown.
(2) Below the search, a note tells you when pricing and other data were last refreshed, with a Report an issue link for anything that looks off (more on both further down).
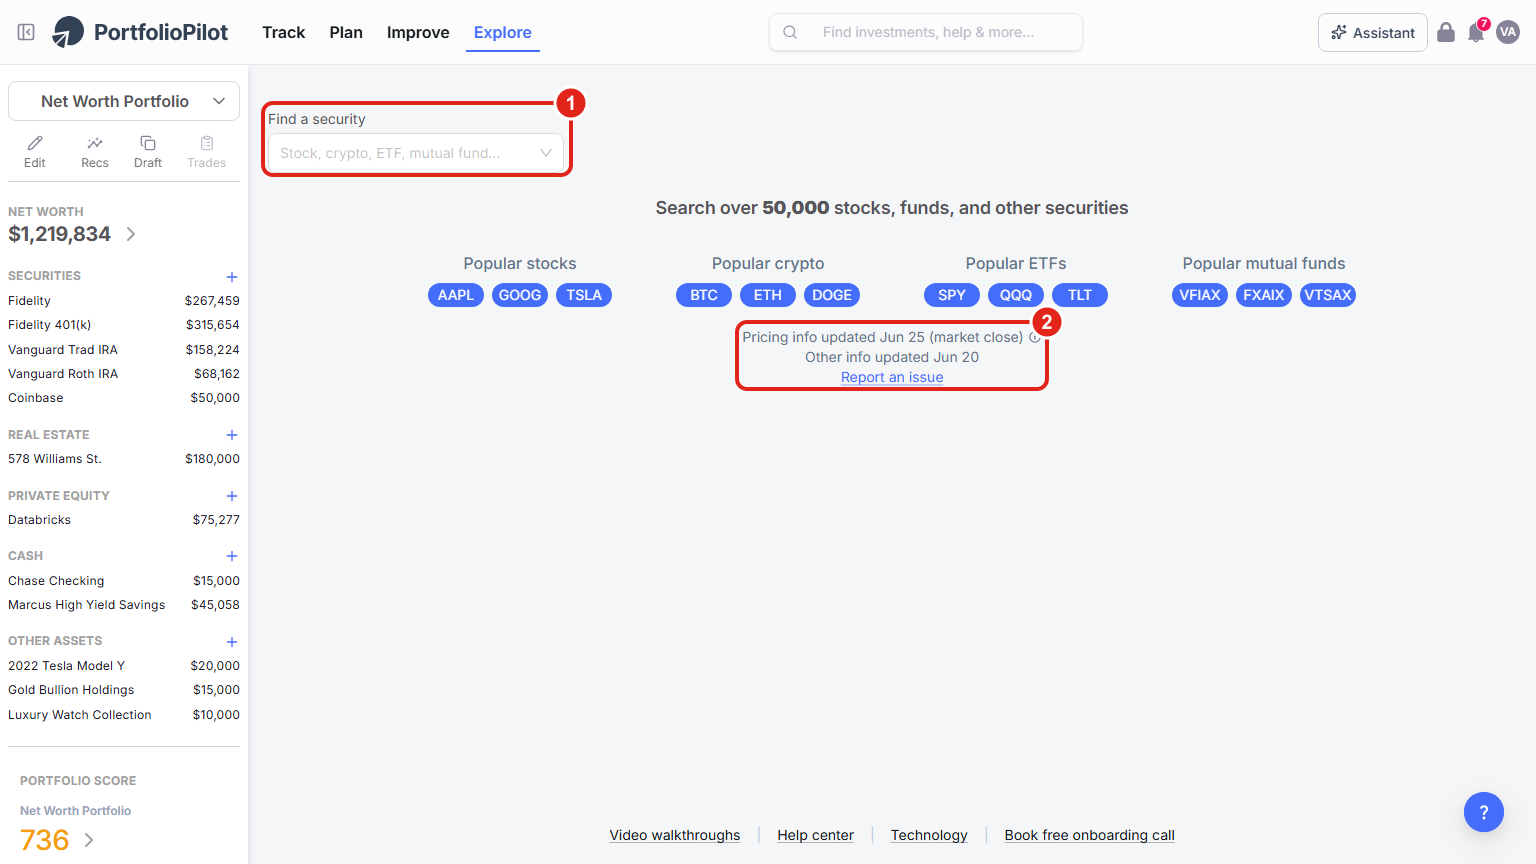
Search over 50,000 securities, and report anything that looks wrong. Figures shown are illustrative.
On a phone, the search box and the popular securities sit at the top of the screen (1), and each security profile opens below them.
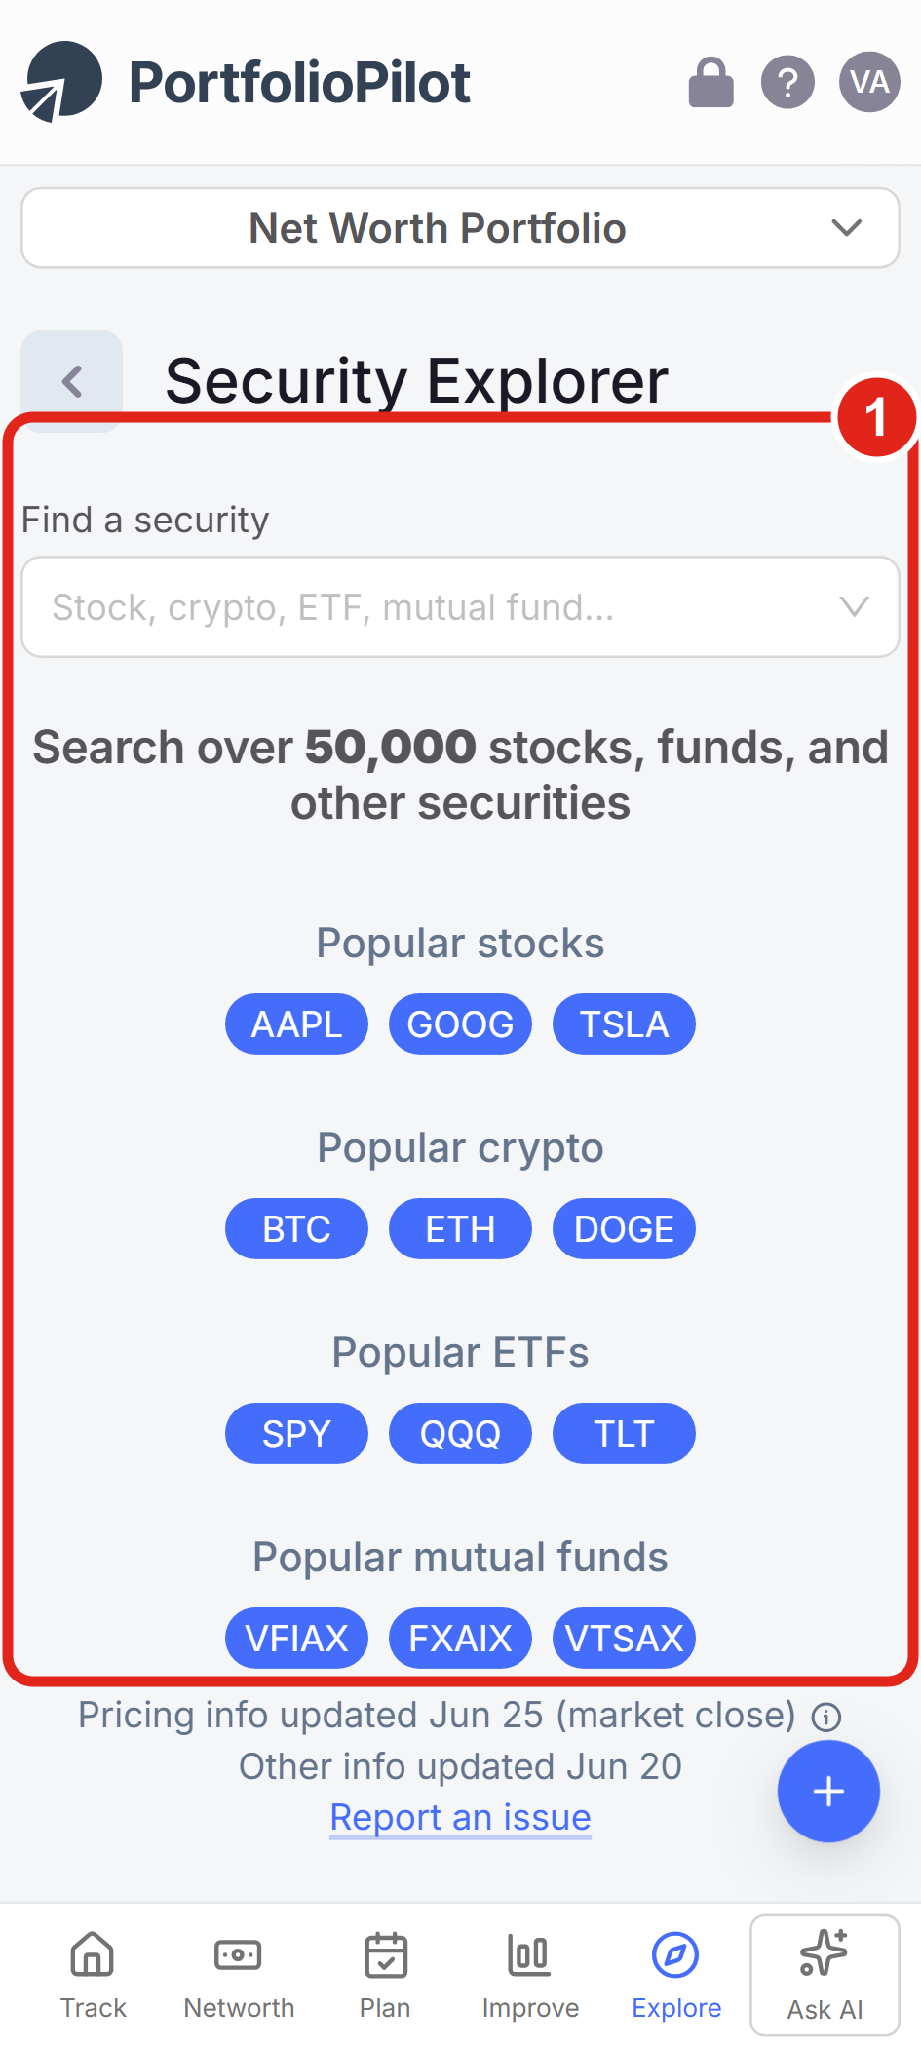
Mobile view: the Security Explorer search box and popular securities. Figures shown are illustrative.
Performance and forecast
Once you open a security, its profile is organized into tabs.
(1) The tabs, Performance, Forecast, Profile, Macro sensitivity, Valuation, Events, Related securities, and News, move you through everything PortfolioPilot knows about the security. The profile opens on Performance, with the price history and a forward-looking forecast cone (a central forecast with low and high bounds); use the zoom controls (30d through All) to change the window.
(2) From any tab you can Add to draft to test the security in a draft of your portfolio.
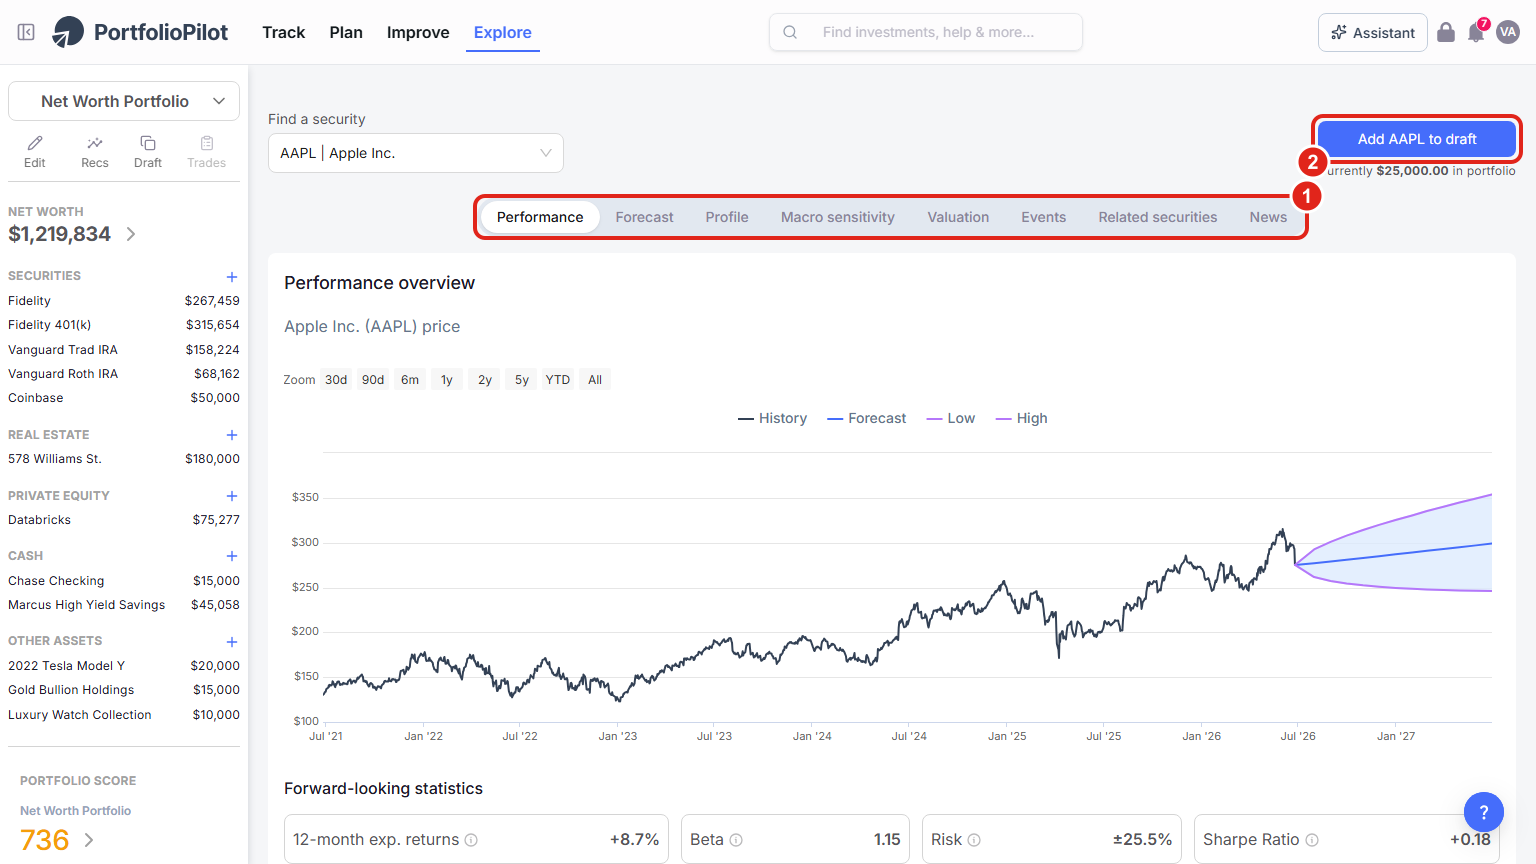
Each profile opens on Performance: price history plus a forward-looking forecast. Figures shown are illustrative.
Detailed forecast
On the Forecast tab, PortfolioPilot shows how it arrives at the security's expected return. The headline figure is not a single guess. It is a weighted blend of contributing forecasts, shown so you can see what is pulling it up or down:
(1) The headline 12-month expected return.
(2) The individual forecast components (weighted-sum) that combine into it: a market-beta (CAPM) forecast, the total US stock market, the relevant sector (here US Technology), the S&P 500, and PortfolioPilot's proprietary statistical and machine-learning (Stats / ML) forecast.
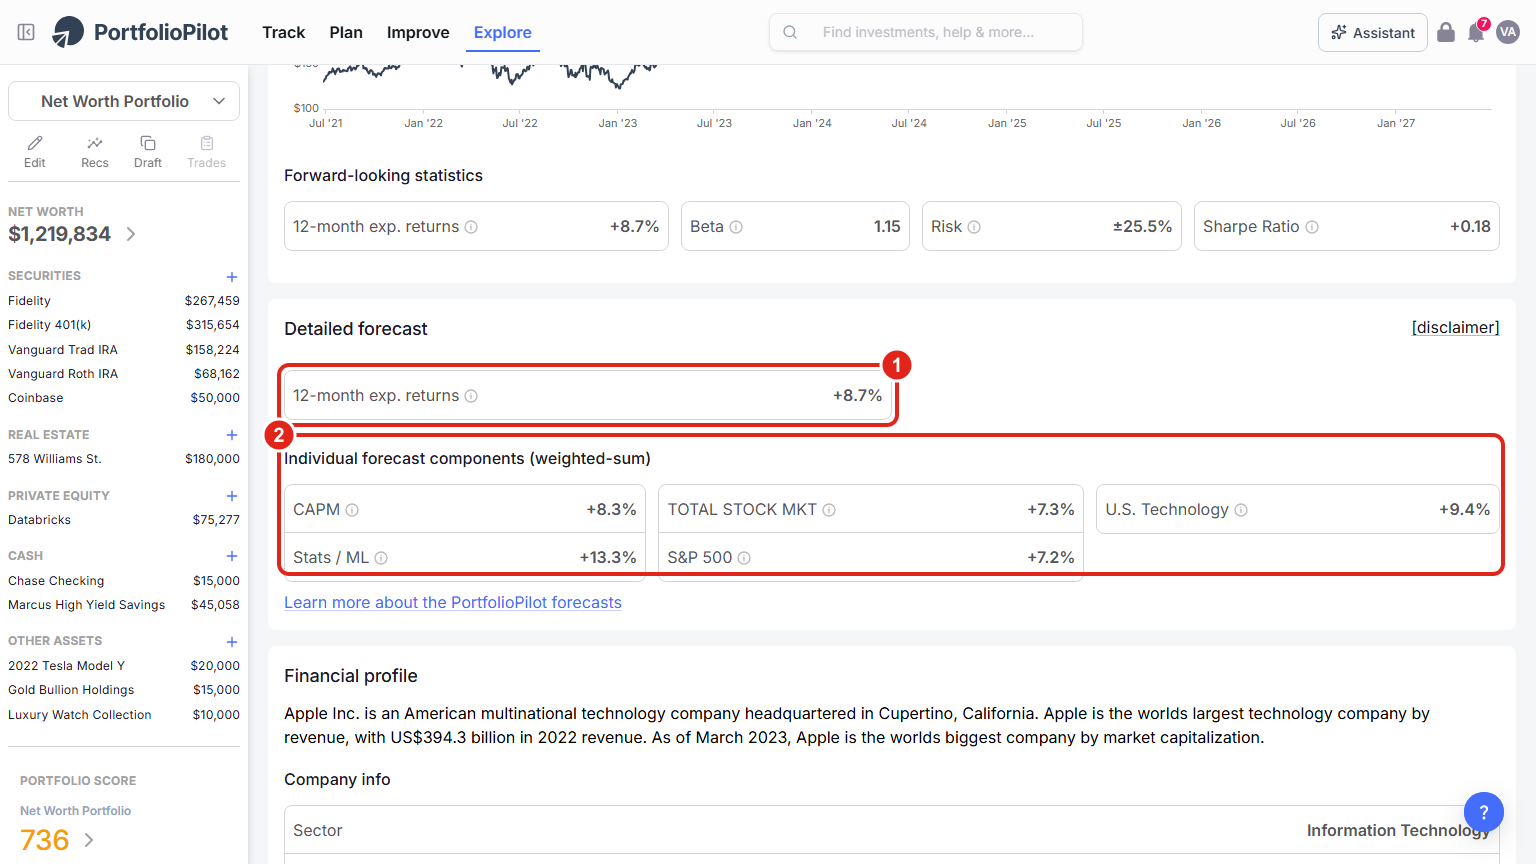
The detailed forecast breaks the expected return into its parts, so you can see what drives it. Values are illustrative.
Macro factor sensitivity
On the Macro sensitivity tab, you see how the security reacts to surprises in the big macroeconomic forces: Growth, Inflation, Credit, Commodities, Liquidity, and Interest Rates.
(1) Each factor has a value whose sign is the direction (a positive number means the security tends to benefit when that factor surprises to the upside; negative means it tends to be hurt) and whose size is the strength of the link. As a rule of thumb, 0 to 3 is low impact, 3 to 7 is medium, and 7 or above is high.
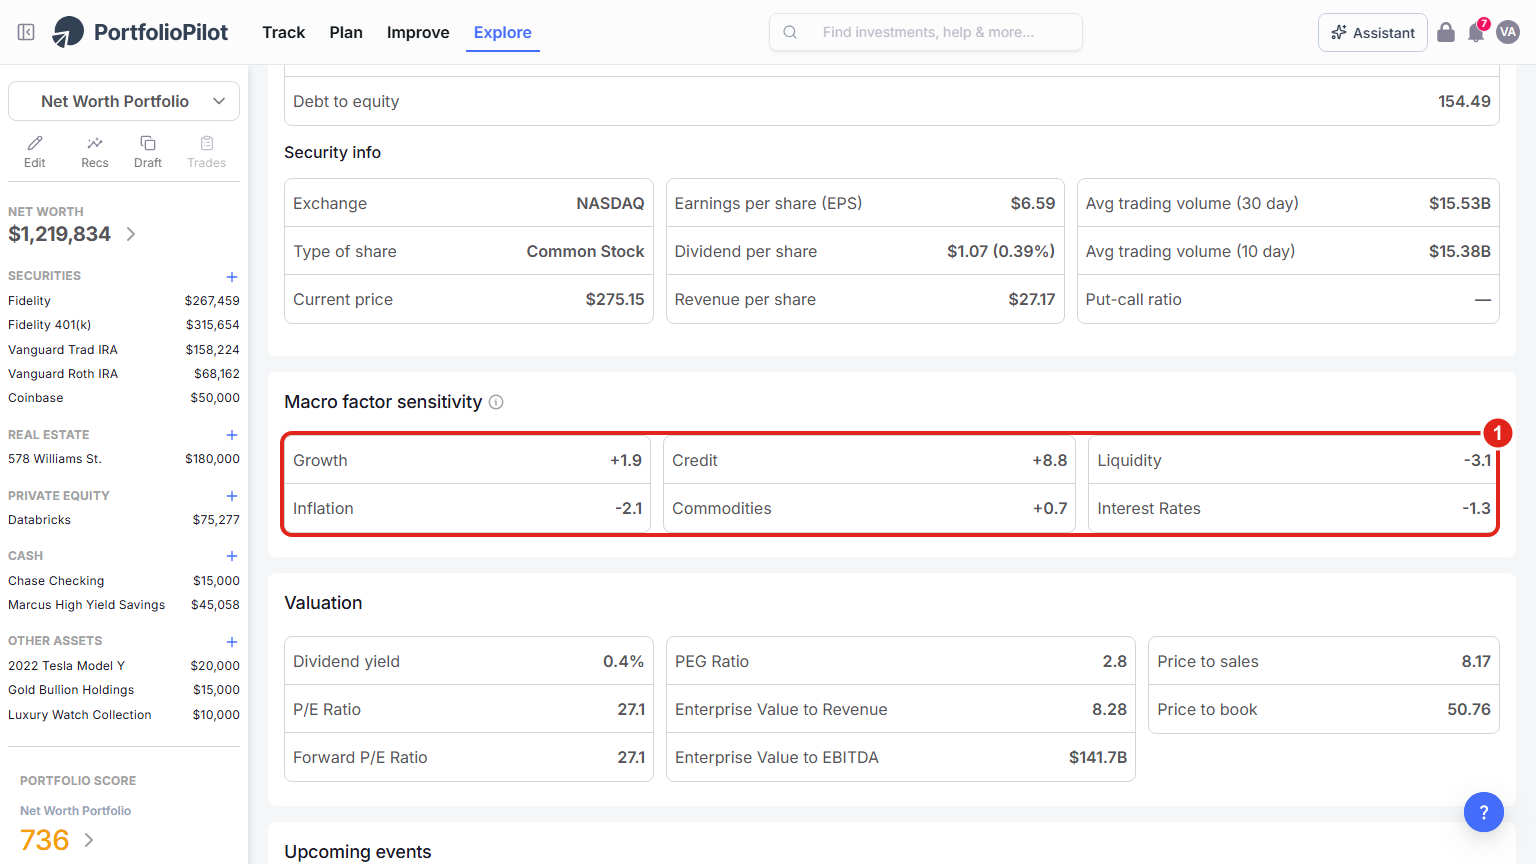
Macro factor sensitivity shows what really drives a holding. Sign is direction, size is strength. Values are illustrative.
The remaining tabs round out your research: Profile (the company's financials and key facts), Valuation, Events (upcoming shareholder dates), Related securities, and News filtered to that security.
Market anomalies
The Anomalies feed flags securities and indicators that are moving unusually versus their expected trend, deviations the engine detects automatically. It is a quick way to spot emerging trends and outliers early. Open Anomalies to browse the feed.
(1) Each anomaly comes with a short, plain-English explanation of what moved and by how much.
(2) A time-series chart shows the move in context, with the usual zoom controls. If one looks interesting, open it in the Security Explorer for the full picture.
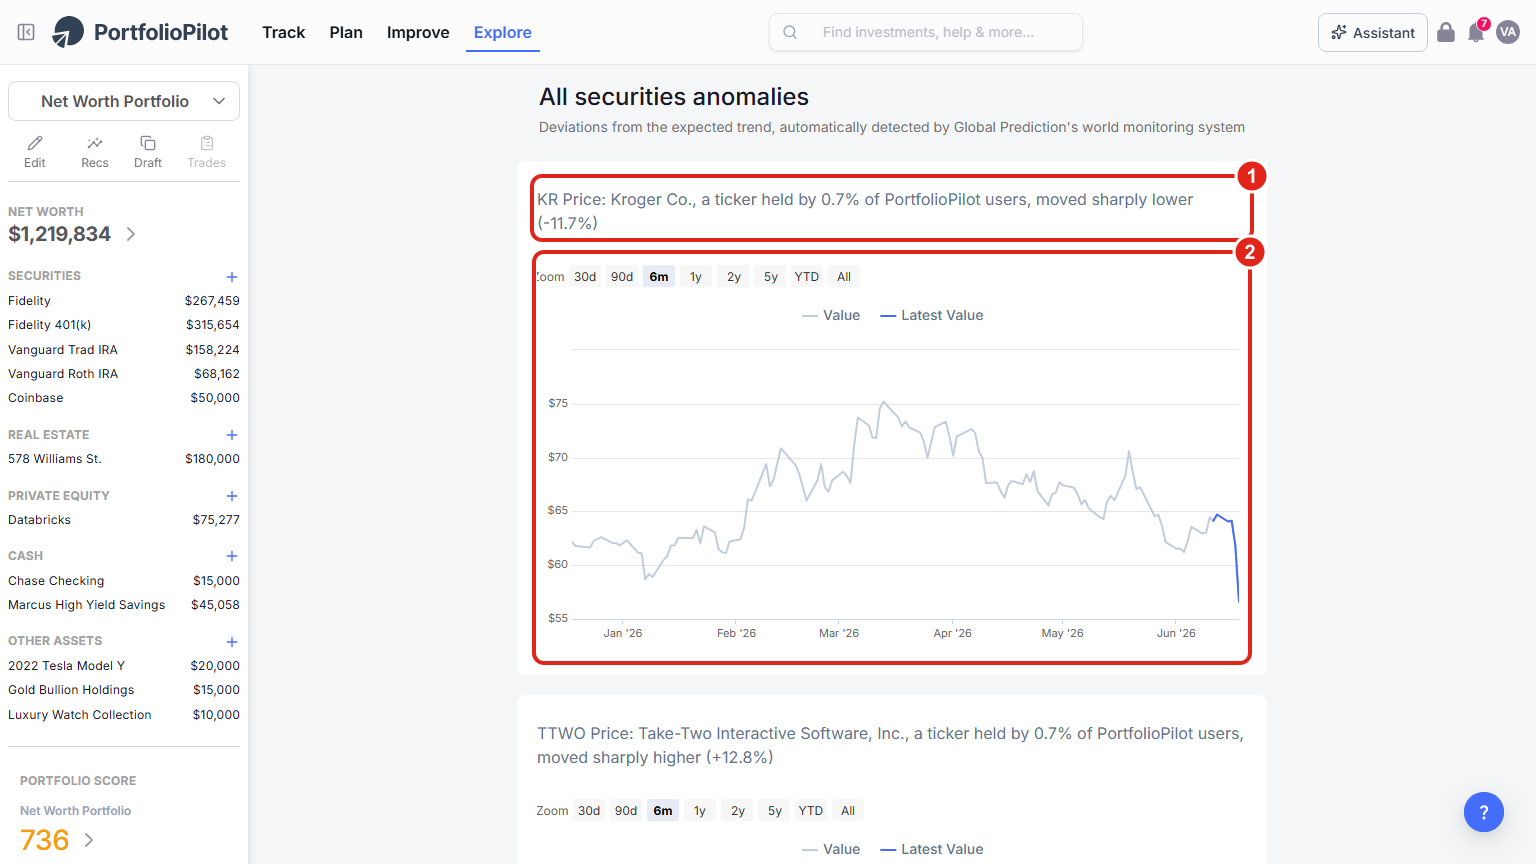
Anomalies surface unusual moves, each with an explanation and a chart. Examples shown are illustrative.
On a phone, each anomaly is a full-width card (1), the explanation on top and the chart below, that you scroll through one at a time.
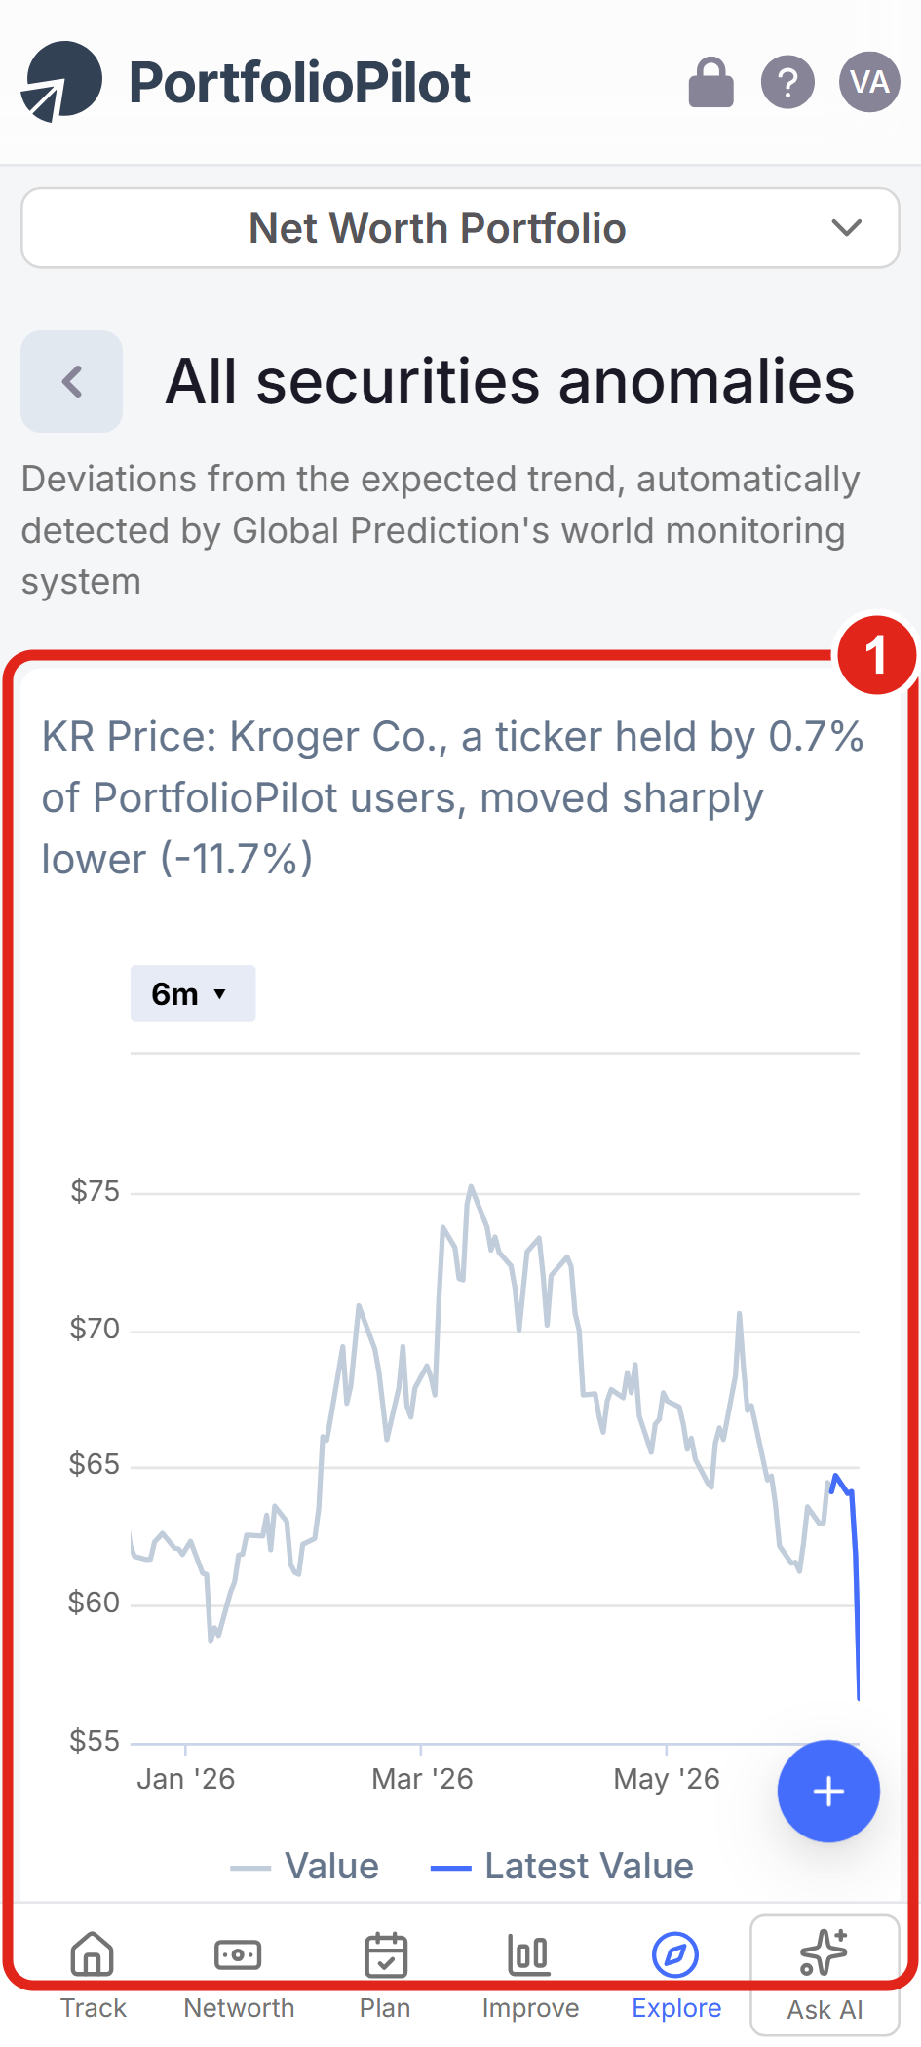
Mobile view: each anomaly as a full-width card. Examples shown are illustrative.
Macro Explorer
The Macro Explorer is the deepest layer of Explore, for when you want the raw economic data behind the forecasts. Open the Macro Explorer to dig in.
(1) Pick a Country and a Macro indicator. PortfolioPilot has data for the G20 and thousands of indicators, to chart its history.
(2) Or start from a popular indicator such as GDP, M2 money supply, unemployment, or consumer prices.
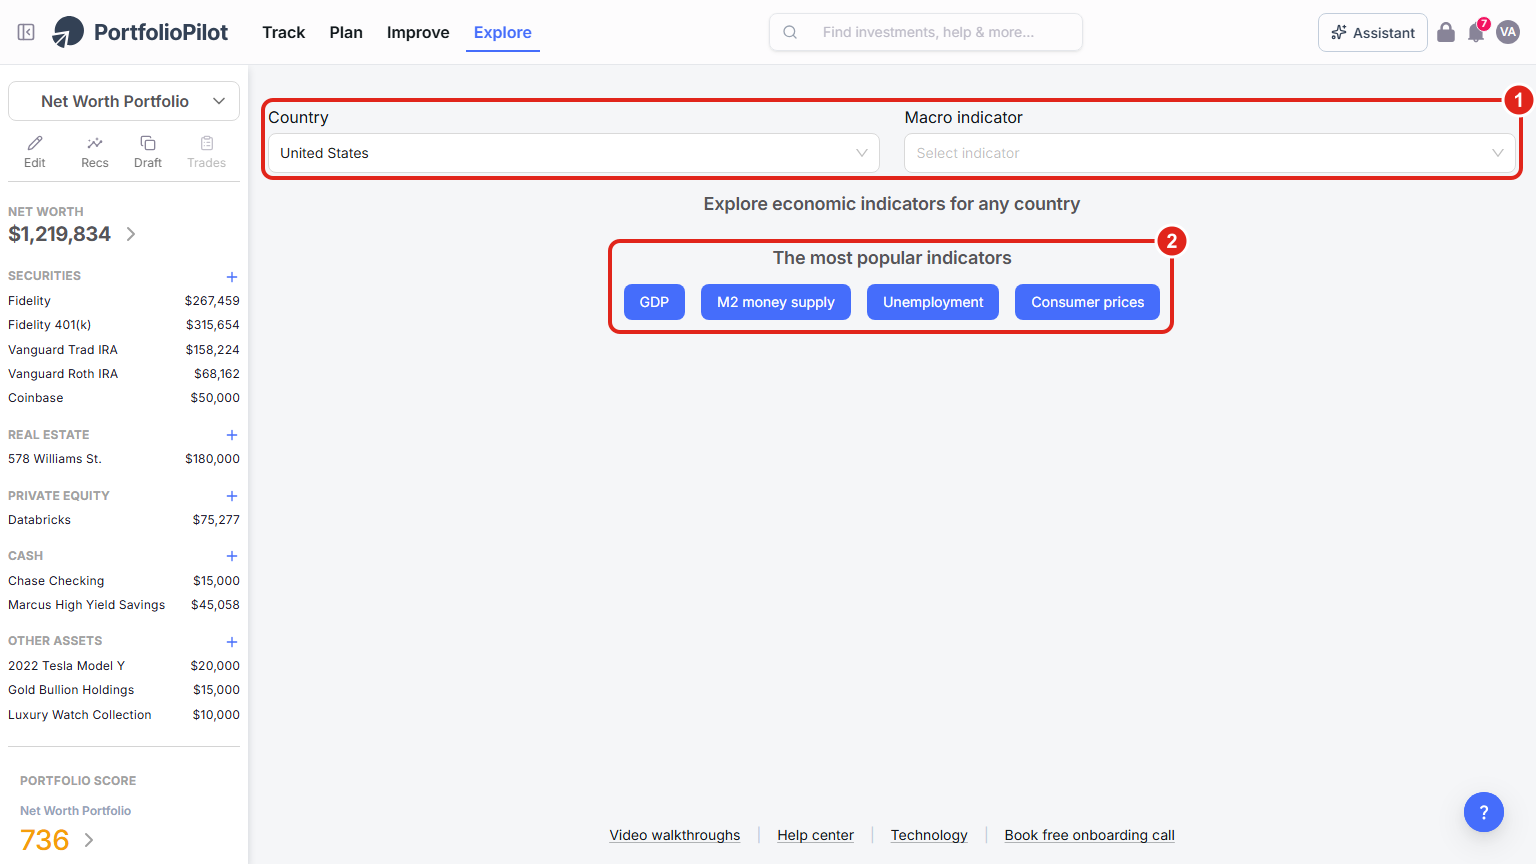
The Macro Explorer charts economic indicators for countries around the world.
The sections that follow, if a security is missing, how Explore is powered, a note on data freshness, common use cases, and next steps, are background reading rather than steps.
If a security is missing or the data looks wrong
Explore covers more than 50,000 securities, but occasionally you may search for something that is not there, or notice a figure that looks off. What to do:
- A figure looks wrong: use the Report an issue link (near the data-updated note on the Security Explorer and screeners) to flag it, and the team reviews the underlying data.
- The security is not in the database: this is common for very new listings, some international tickers, and certain ADRs or bonds. You can still track it by adding it as a custom security or mapping it to a close proxy. See Customization Features.
How Explore is powered
Everything in Explore runs on PortfolioPilot's Economic Insights Engine, the same system that powers the recommendations elsewhere in the product. It pulls in and processes tens of thousands of macroeconomic series, links them to over 50,000 securities, and uses a blend of proprietary economic models, machine learning, and large-language models to produce the forecasts, factor sensitivities, and anomalies you see.
Showing the components behind a forecast, rather than a single number, is deliberate: it lets you judge for yourself what is driving an expectation before you act.
A note on data freshness
Explore reflects end-of-day data, not a live trading feed. Prices are generally shown as of the previous market close, and other information, fundamentals, forecasts, and factor data, is refreshed on a regular daily cadence.
The Security Explorer and screeners show exactly when each was last updated (for example, "Pricing info updated [date] (market close)" and "Other info updated [date]"), so a small gap versus a live quote during market hours is expected, not an error.
Common ways people use Explore
- Find a lower-cost version of a fund you own: in the Fund Screener, filter to the same asset class, sort by expense ratio, and confirm the cheaper option still has a comparable expected return and Sharpe ratio, then add it to a draft.
- Research a theme: use AI equity research to turn an idea like "emerging fintech" into a basket, then open the most interesting names in the Security Explorer to read their forecast and macro sensitivities.
- Pressure-test a stock before buying: open its profile, read the forecast components and macro factor sensitivities to understand what drives it, and add it to a draft to see how it changes your Portfolio Score.
Why this matters
Good decisions start with good research. Explore puts the same data and models that power PortfolioPilot's recommendations directly in your hands, so you can understand the market environment, compare investments on the metrics that actually matter, and see what is driving any security before you act. And because every result can be added to a Draft Portfolio, research flows straight into action: you can go from a question about the market to a concrete change you have tested against your own strategy, all in one place.
Next steps
- Tutorial: Draft Portfolio. Take anything you find in Explore and test it in a safe copy of your portfolio.
- Tutorial: AI Assistant. Ask for screens, fund comparisons, and security research in plain English.
- Tutorial: Personalized Recommendations. Let PortfolioPilot suggest specific moves, including lower-fee fund replacements.
- Tutorial: Portfolio Score. Understand the score that updates when you add a security from Explore to a draft.
- Tutorial: Customization Features. Add a custom security or proxy when something is not in the database.
- Tutorial: Import Your Net Worth. Connect your accounts so you can act on what you find.
Explore is powered by PortfolioPilot's Economic Insights Engine, which combines proprietary economic models, machine-learning methods, and large-language models. Forecasts, expected returns, Sharpe ratios, anomalies, and any securities shown are for illustrative and educational purposes only and are not recommendations to buy or sell. Model output can be incomplete or wrong; review it before you act.
Global Predictions provides investment advice only through its internet-based application, PortfolioPilot, and only to individuals who are advisory clients of Global Predictions pursuant to written advisory Client Agreements ("Advisory Services"). The publicly available portions of the Platform (i.e., the sections of the Platform that are available to individuals who are not party to a Client Agreement, including globalpredictions.com and portions of portfoliopilot.com) are provided for educational purposes only and are not intended to provide legal, tax, or financial planning advice. To the extent that any of the content published on publicly available portions of the Platform may be deemed to be investment advice, such information is impersonal and not tailored to the investment needs of any specific person. Nothing on the publicly available portions of the Platform should be construed as a solicitation or offer, or recommendation, to buy or sell any security. All charts, figures, and graphs on the publicly available websites are for illustrative purposes only. Before investing, you should consider whether any investment, investment strategy, security, other asset, or related transaction is appropriate for you based on your personal investment objectives, financial circumstances, and risk tolerance. You are also encouraged to consult your legal, tax, or investment professional regarding your specific situation. Registration does not imply a certain level of skill or training. Investing involves risk. The value of your investment will fluctuate, and you may gain or lose money.
Case studies presented are hypothetical scenarios and intended for illustrative purposes only. They do not represent an actual client, investment or experience, but rather are meant to provide an example of the intended investment process and methodology. An individual's experience may vary based on his or her circumstances. There can be no assurance that the Firm will be able to achieve similar results in comparable situations. No portion of this case study is to be interpreted as a testimonial or endorsement of the Firm's investment advisory services. The information contained herein should not be construed as personal investment advice.
The contents of the Platform may contain forward-looking statements that are based on management's beliefs, assumptions, current expectations, estimates, and projections about the financial industry, the economy, or Global Predictions itself. Forward-looking statements are not guarantees of the underlying expected actions or future performance, and future results may differ significantly from those anticipated by the forward-looking statements. Note: our use of the term AI refers to all artificial intelligence models used, including large language models, proprietary economic models that incorporate regression or dynamic factors, and machine learning methods like supervised learning. For more information, see our disclosures at globalpredictions.com/disclosures.
Most of Explore, the market overview, the stock and fund screeners, security profiles, anomalies, and the Macro Explorer, is available on the free plan. AI Equity Research is a Platinum (and Pro) feature, and some forward-looking figures such as expected return and Sharpe ratio may require a subscription. All paid plans come with a 10-day free trial, no credit card required.
